

A Tale of Two Distillers
A Tale of Two Distillers
An overview of Diageo (DEO) & Brown-Forman (BF.B).

The Industry. Alcoholic beverages aren’t going anywhere. They have been an important part of social life in countless cultures for thousands of years. The psychoactive substance that many of us drink at weddings, parties, and nights out (and in) is one of the most widely used recreational drugs in the world with about a third of all people on Earth drinking alcoholic beverages. In 2015, 86% of adults in America had consumed alcohol at some point, with 70% drinking it in the last year and 56% in the last month. Consumable alcohol is generally broken down into three categories: beer, wine, and spirits.
Distilleries produce spirits by taking the liquid product of grains, fruits, or vegetables that have already gone through the alcoholic fermentation process and concentrating it to raise the percentage of alcohol per unit of volume.
Brandy, for example, is produced by distilling wine. Gin is from barley. Rum from sugarcane. Tequila from blue agave. Vodka from grain (or sometimes potatoes, fruits, or sugar). Whiskey from grain mash. And absinthe from a combination of specific plants. Of course, there are variations within each of these spirit types — ingredients and methods differ based on the distillery, geography, regulations, etc.
Once the alcoholic beverages are produced, they are distributed to retailers. In the U.S., spirits manufacturers are generally required by law to sell their products to distributors or, depending on the state, state governments who, in turn, distribute the goods to retailers and wholesalers. In some countries, governments permit spirits manufacturers to own their own distribution (i.e. the manufacturer can sell to the retailer/wholesaler directly). In other countries, manufacturers must sell their products to the government who then acts as the distributor.
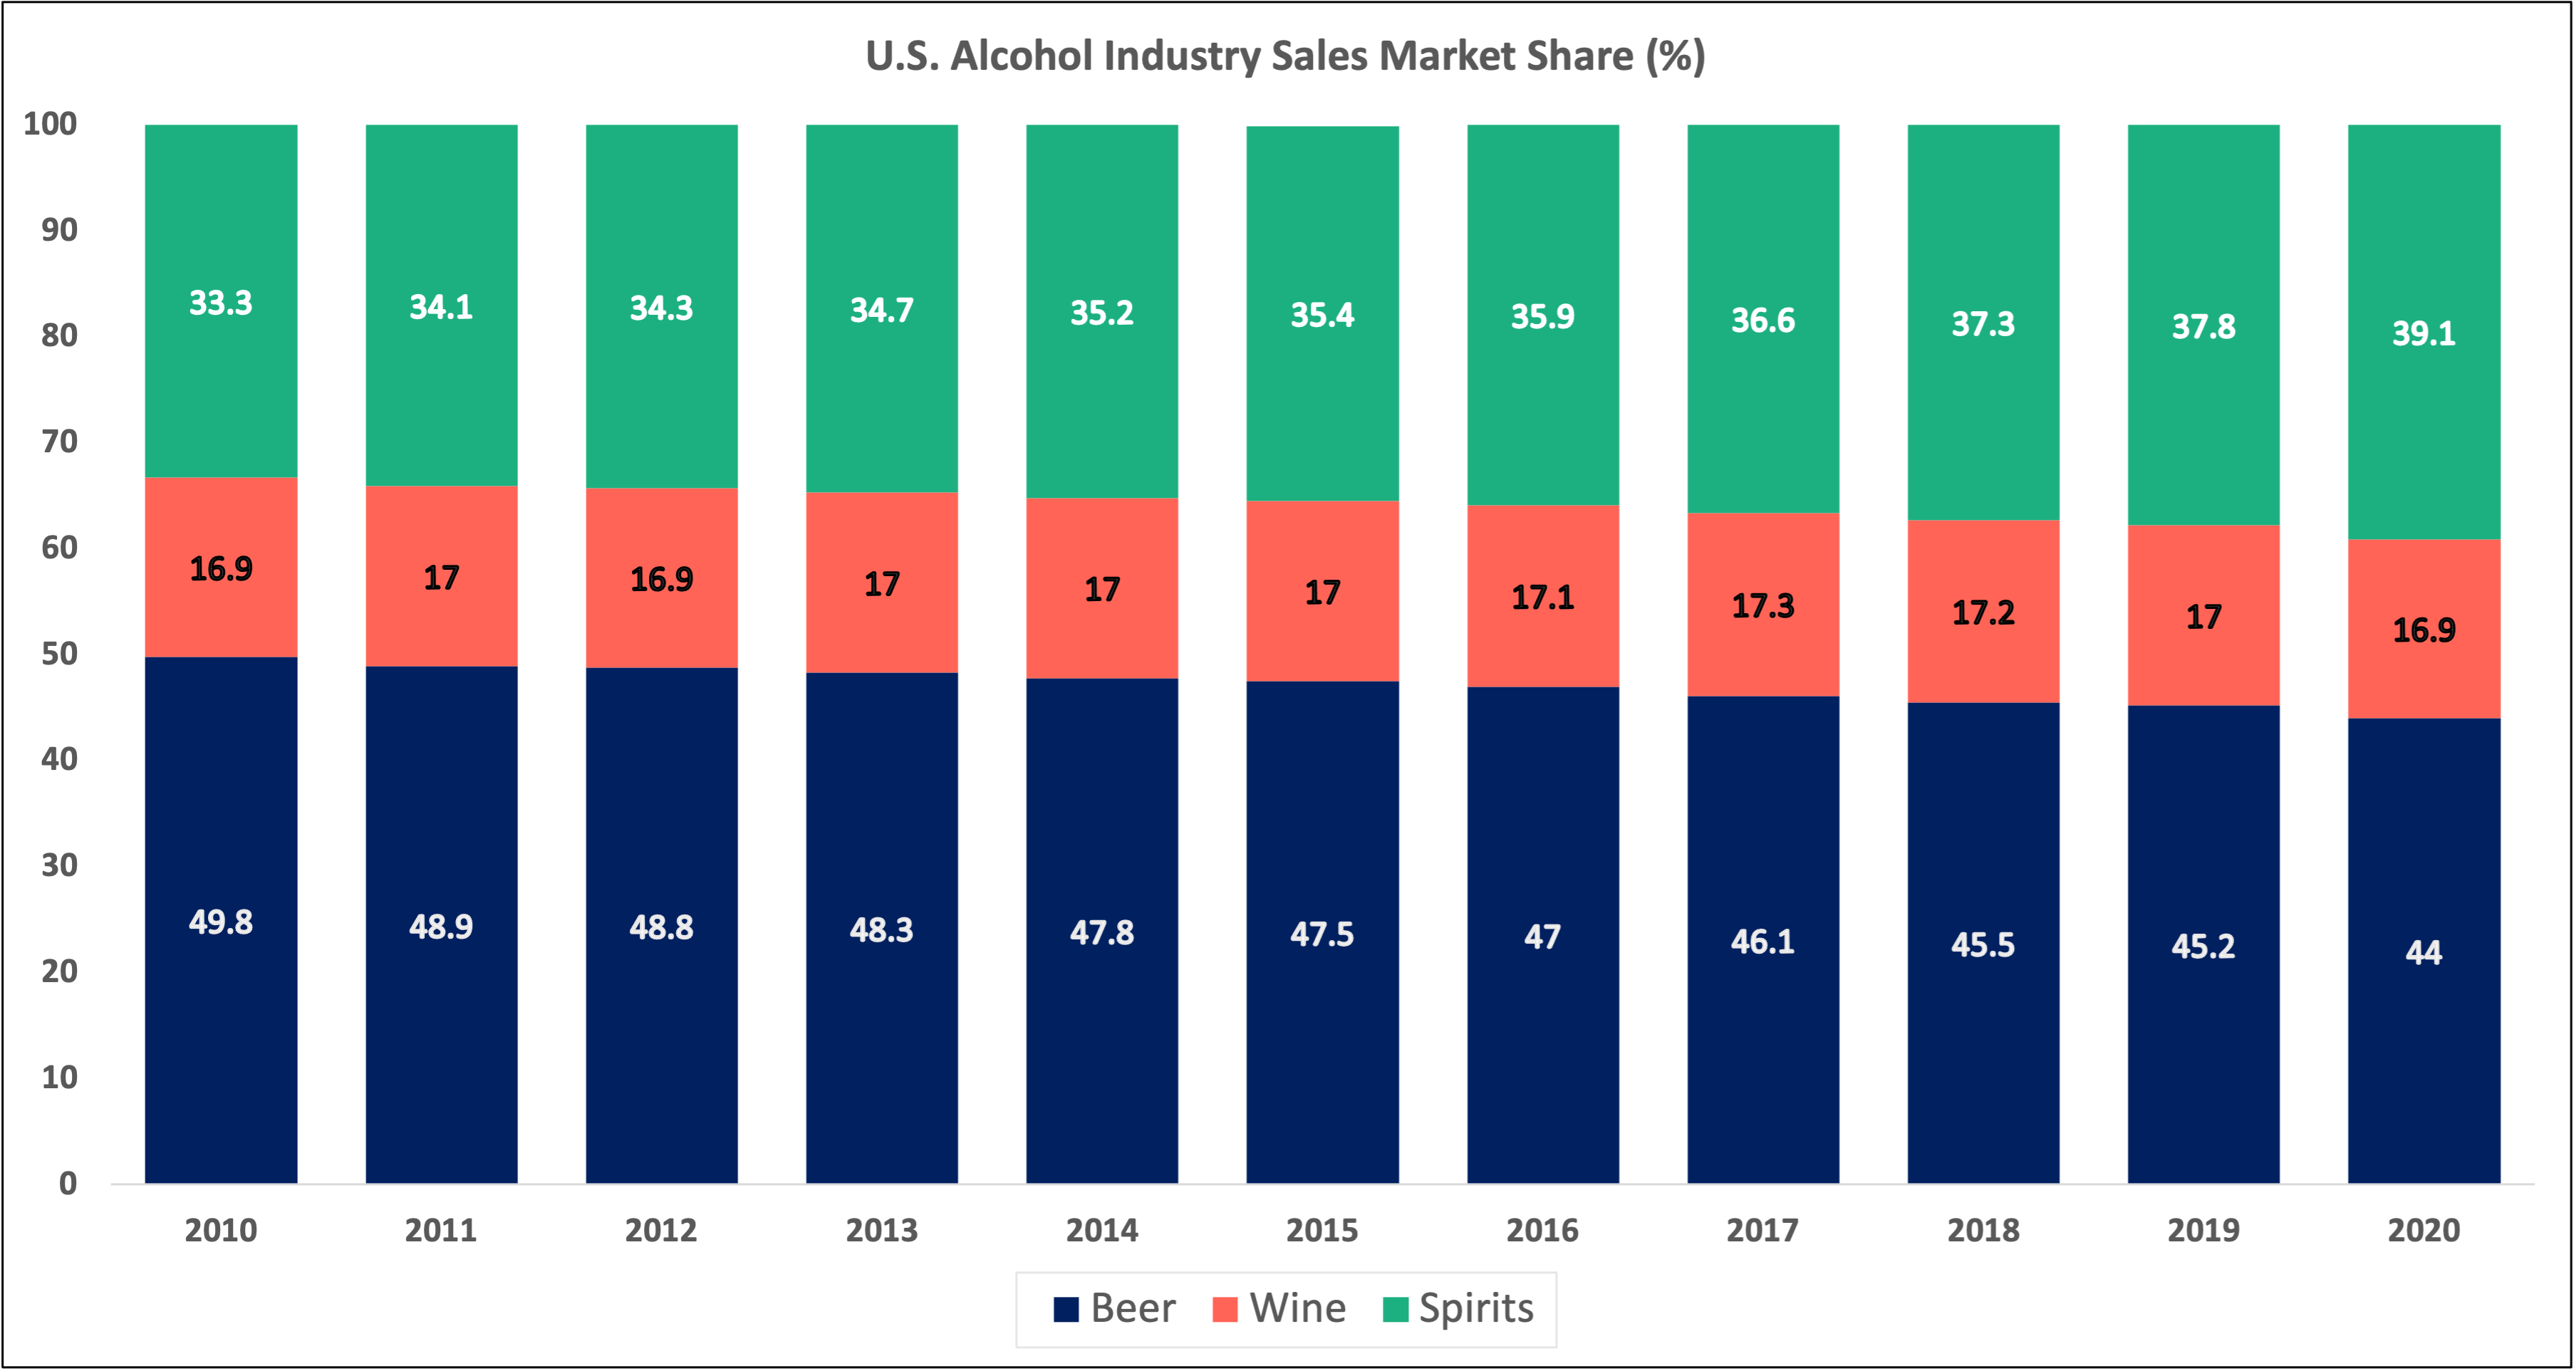
From 2010 to 2020, the beer category in the U.S. has been losing market share to spirits. Beer has dropped from close to 50% of alcohol sales to 44%. Spirits have grown from 33.3% of the market to almost 40%. And wine has held steady at around 17%.
Remarkably, while distilleries command over 30% of global alcohol sales, spirits make up only 10-15% of global alcohol volumes.
Diageo (DEO)
Background. Diageo is the product of a 1997 merger of Guinness and Grand Metropolitan. After decades spent accumulating different businesses (hotels, food brands, restaurants, breweries, distilleries, eye care stores, and many others), GrandMet carried out a series of divestitures in an effort to pare down non-core businesses and focus on three crown jewels: IDV (a distiller/vintner), Pillsbury, and Burger King. After merging with Guinness, the resulting Diageo sold the Pillsbury and Burger King businesses. Today, 85% of Diageo’s sales come from spirits with the remaining 15% coming from a portfolio of beer brands led by Guinness. The company is headquartered in London, reports its financials in pound sterling, and sells its products in over 180 countries. The company’s shares trade in the U.K. (DGE) and in the U.S. (DEO).
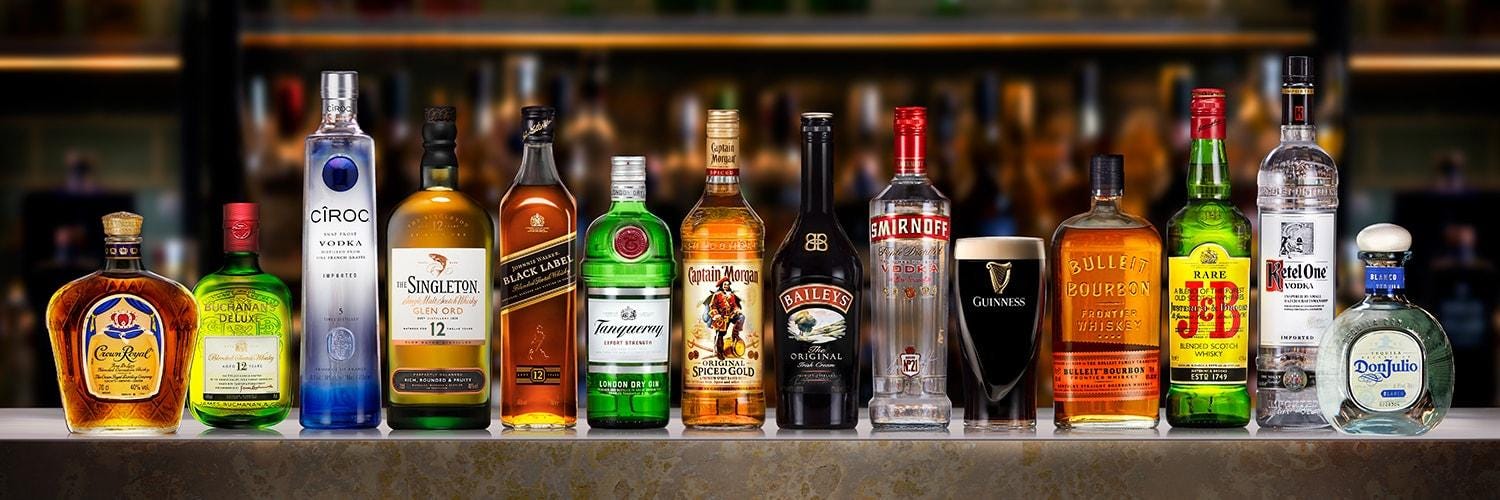
Brands. Diageo owns a diversified portfolio of over 200 alcohol brands. Its heavy hitters — the company calls them “global giants” — are Johnnie Walker (whiskey), Smirnoff (vodka), Baileys (liqueurs), Captain Morgan (rum), Tanqueray (gin), and Guinness (beer). Its portfolio of “local stars” includes names such as Yeni Raki in Turkey and Crown Royal (whiskey) in North America. Diageo also has a group of global luxury brands that it calls “reserve.” These include Ciroc (vodka), Ketel One (vodka), Casamigos (tequila), Don Julio (tequila), and Bulleit (whiskey) among others. Over half of the company’s sales are generated from high-end products like Casamigos and Don Julio. The company has started to dip its toes into high end non-alcoholic spirits (e.g. Seedlip) and ready-to-drink products (RTD) (e.g. Loyal 9 and Ketel One, Crown Royal, Smirnoff, and Gordon’s brand-extensions), though these segments are very small relative to the rest of the company.
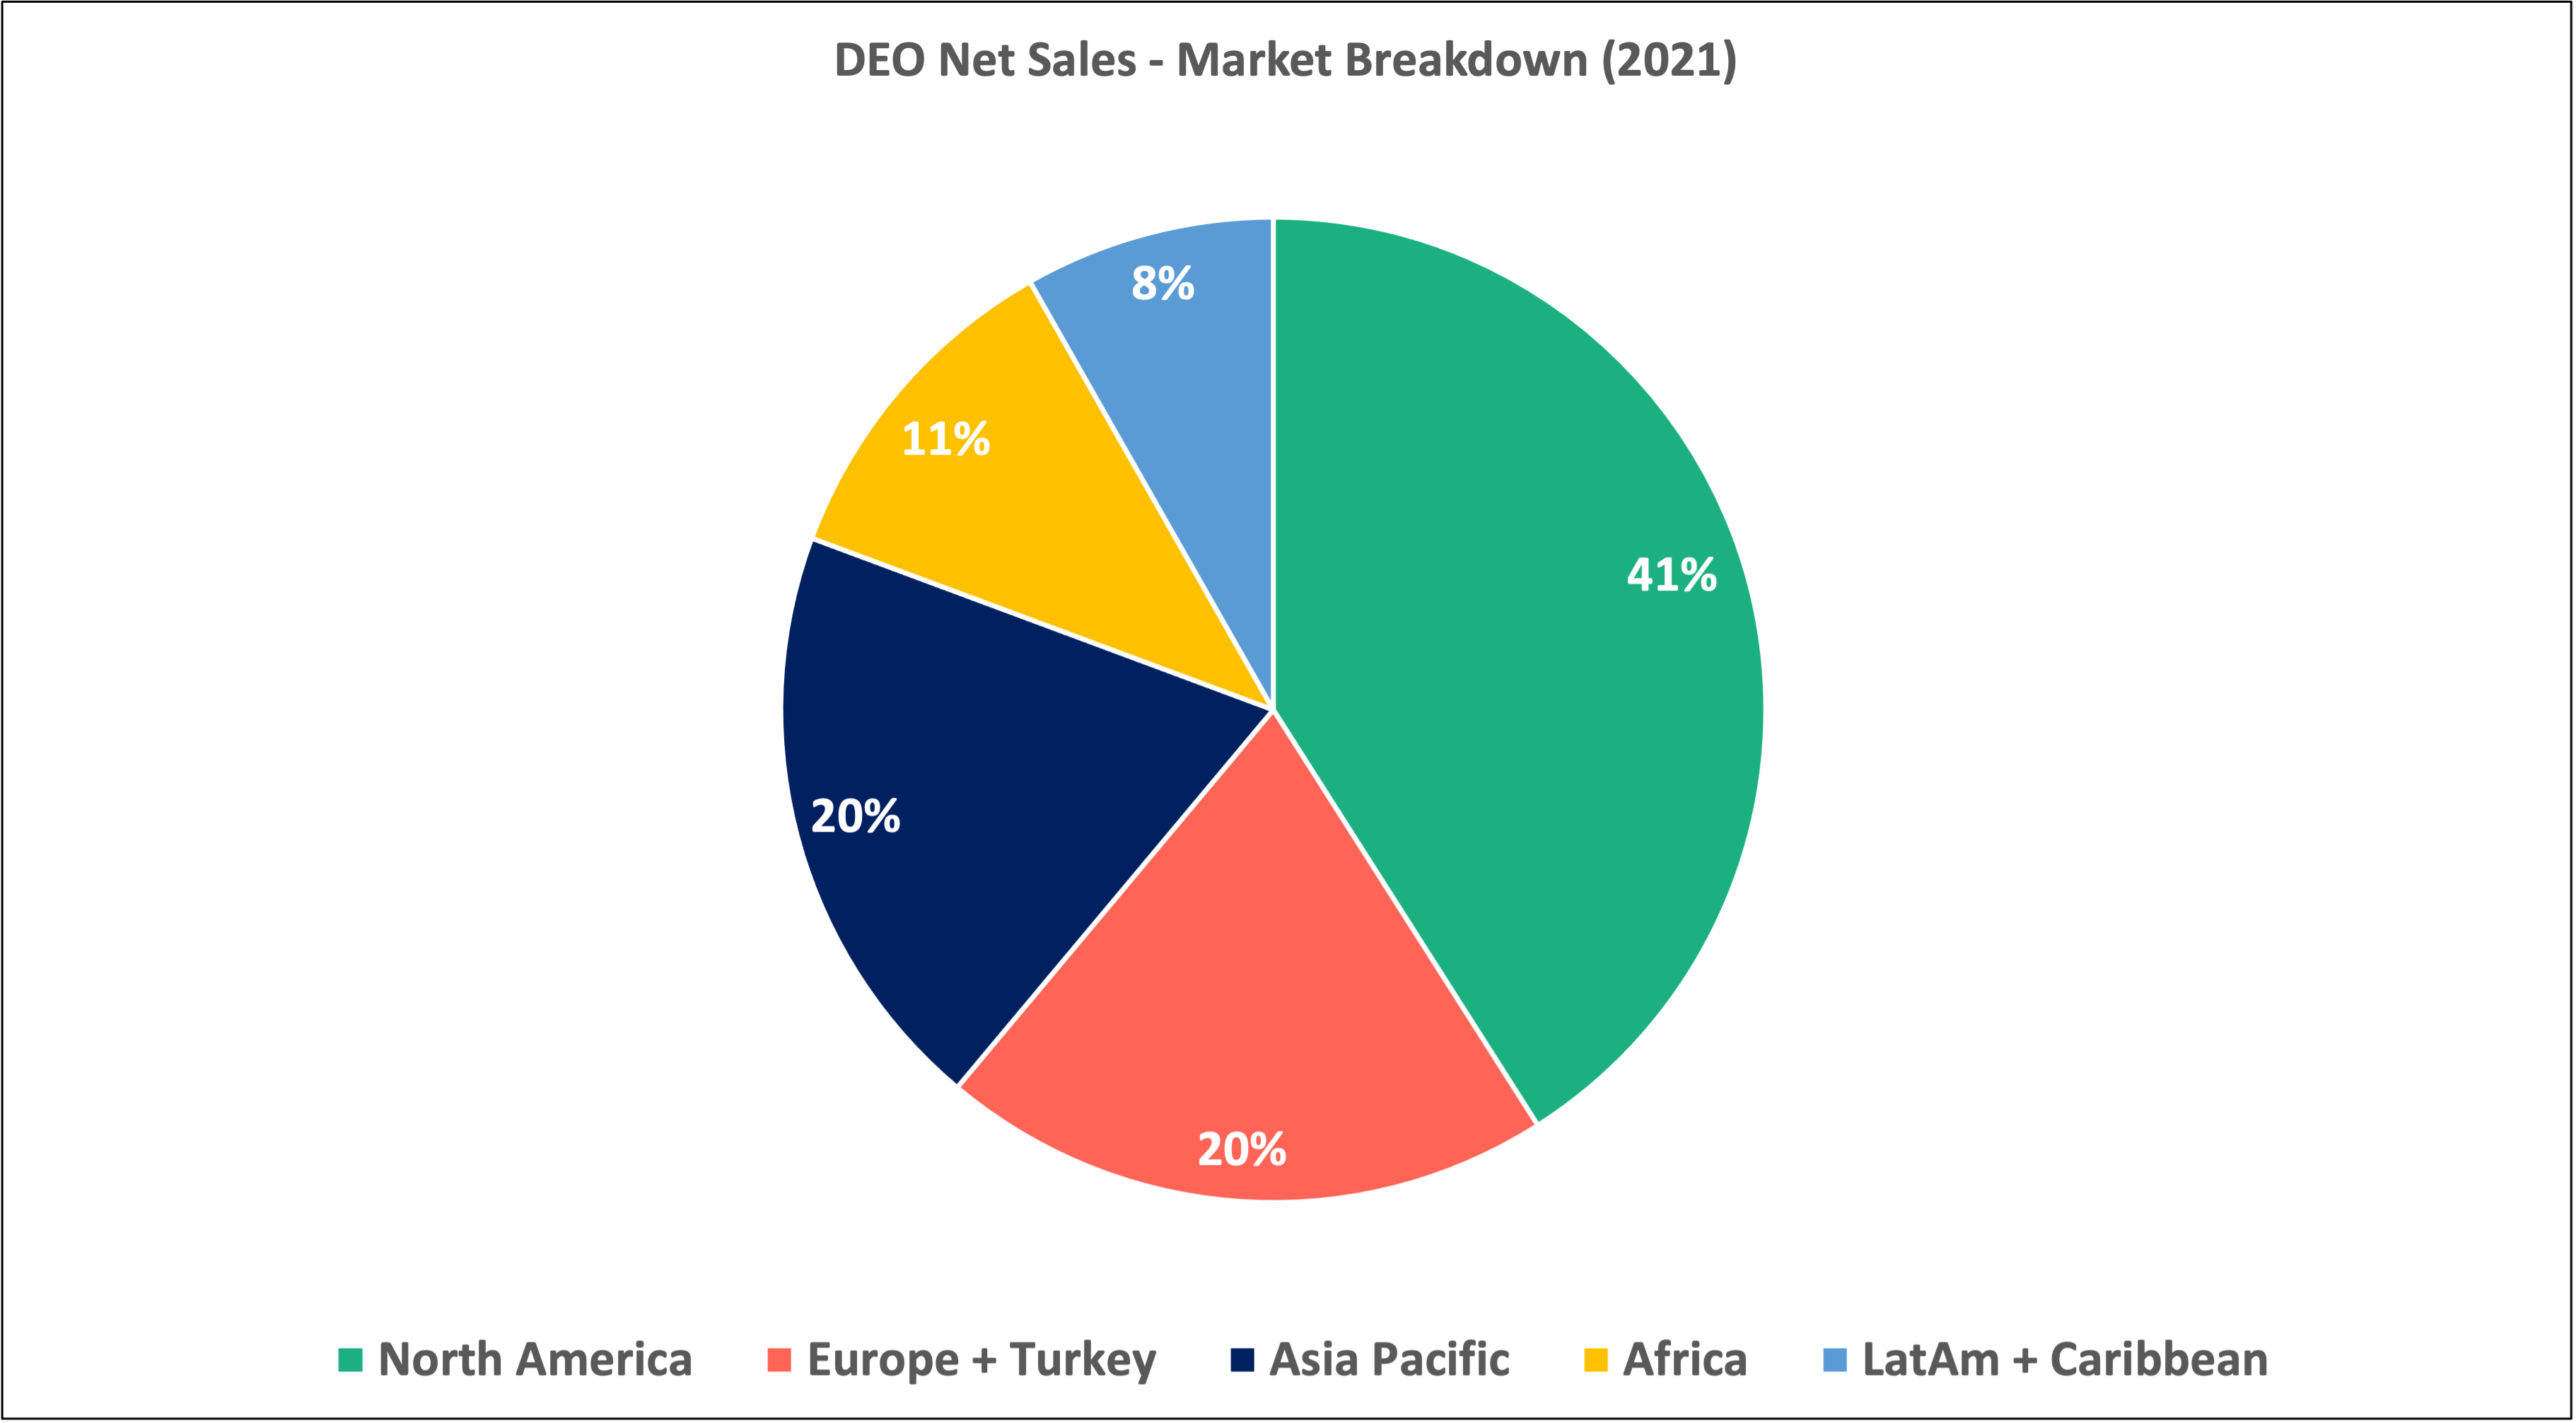
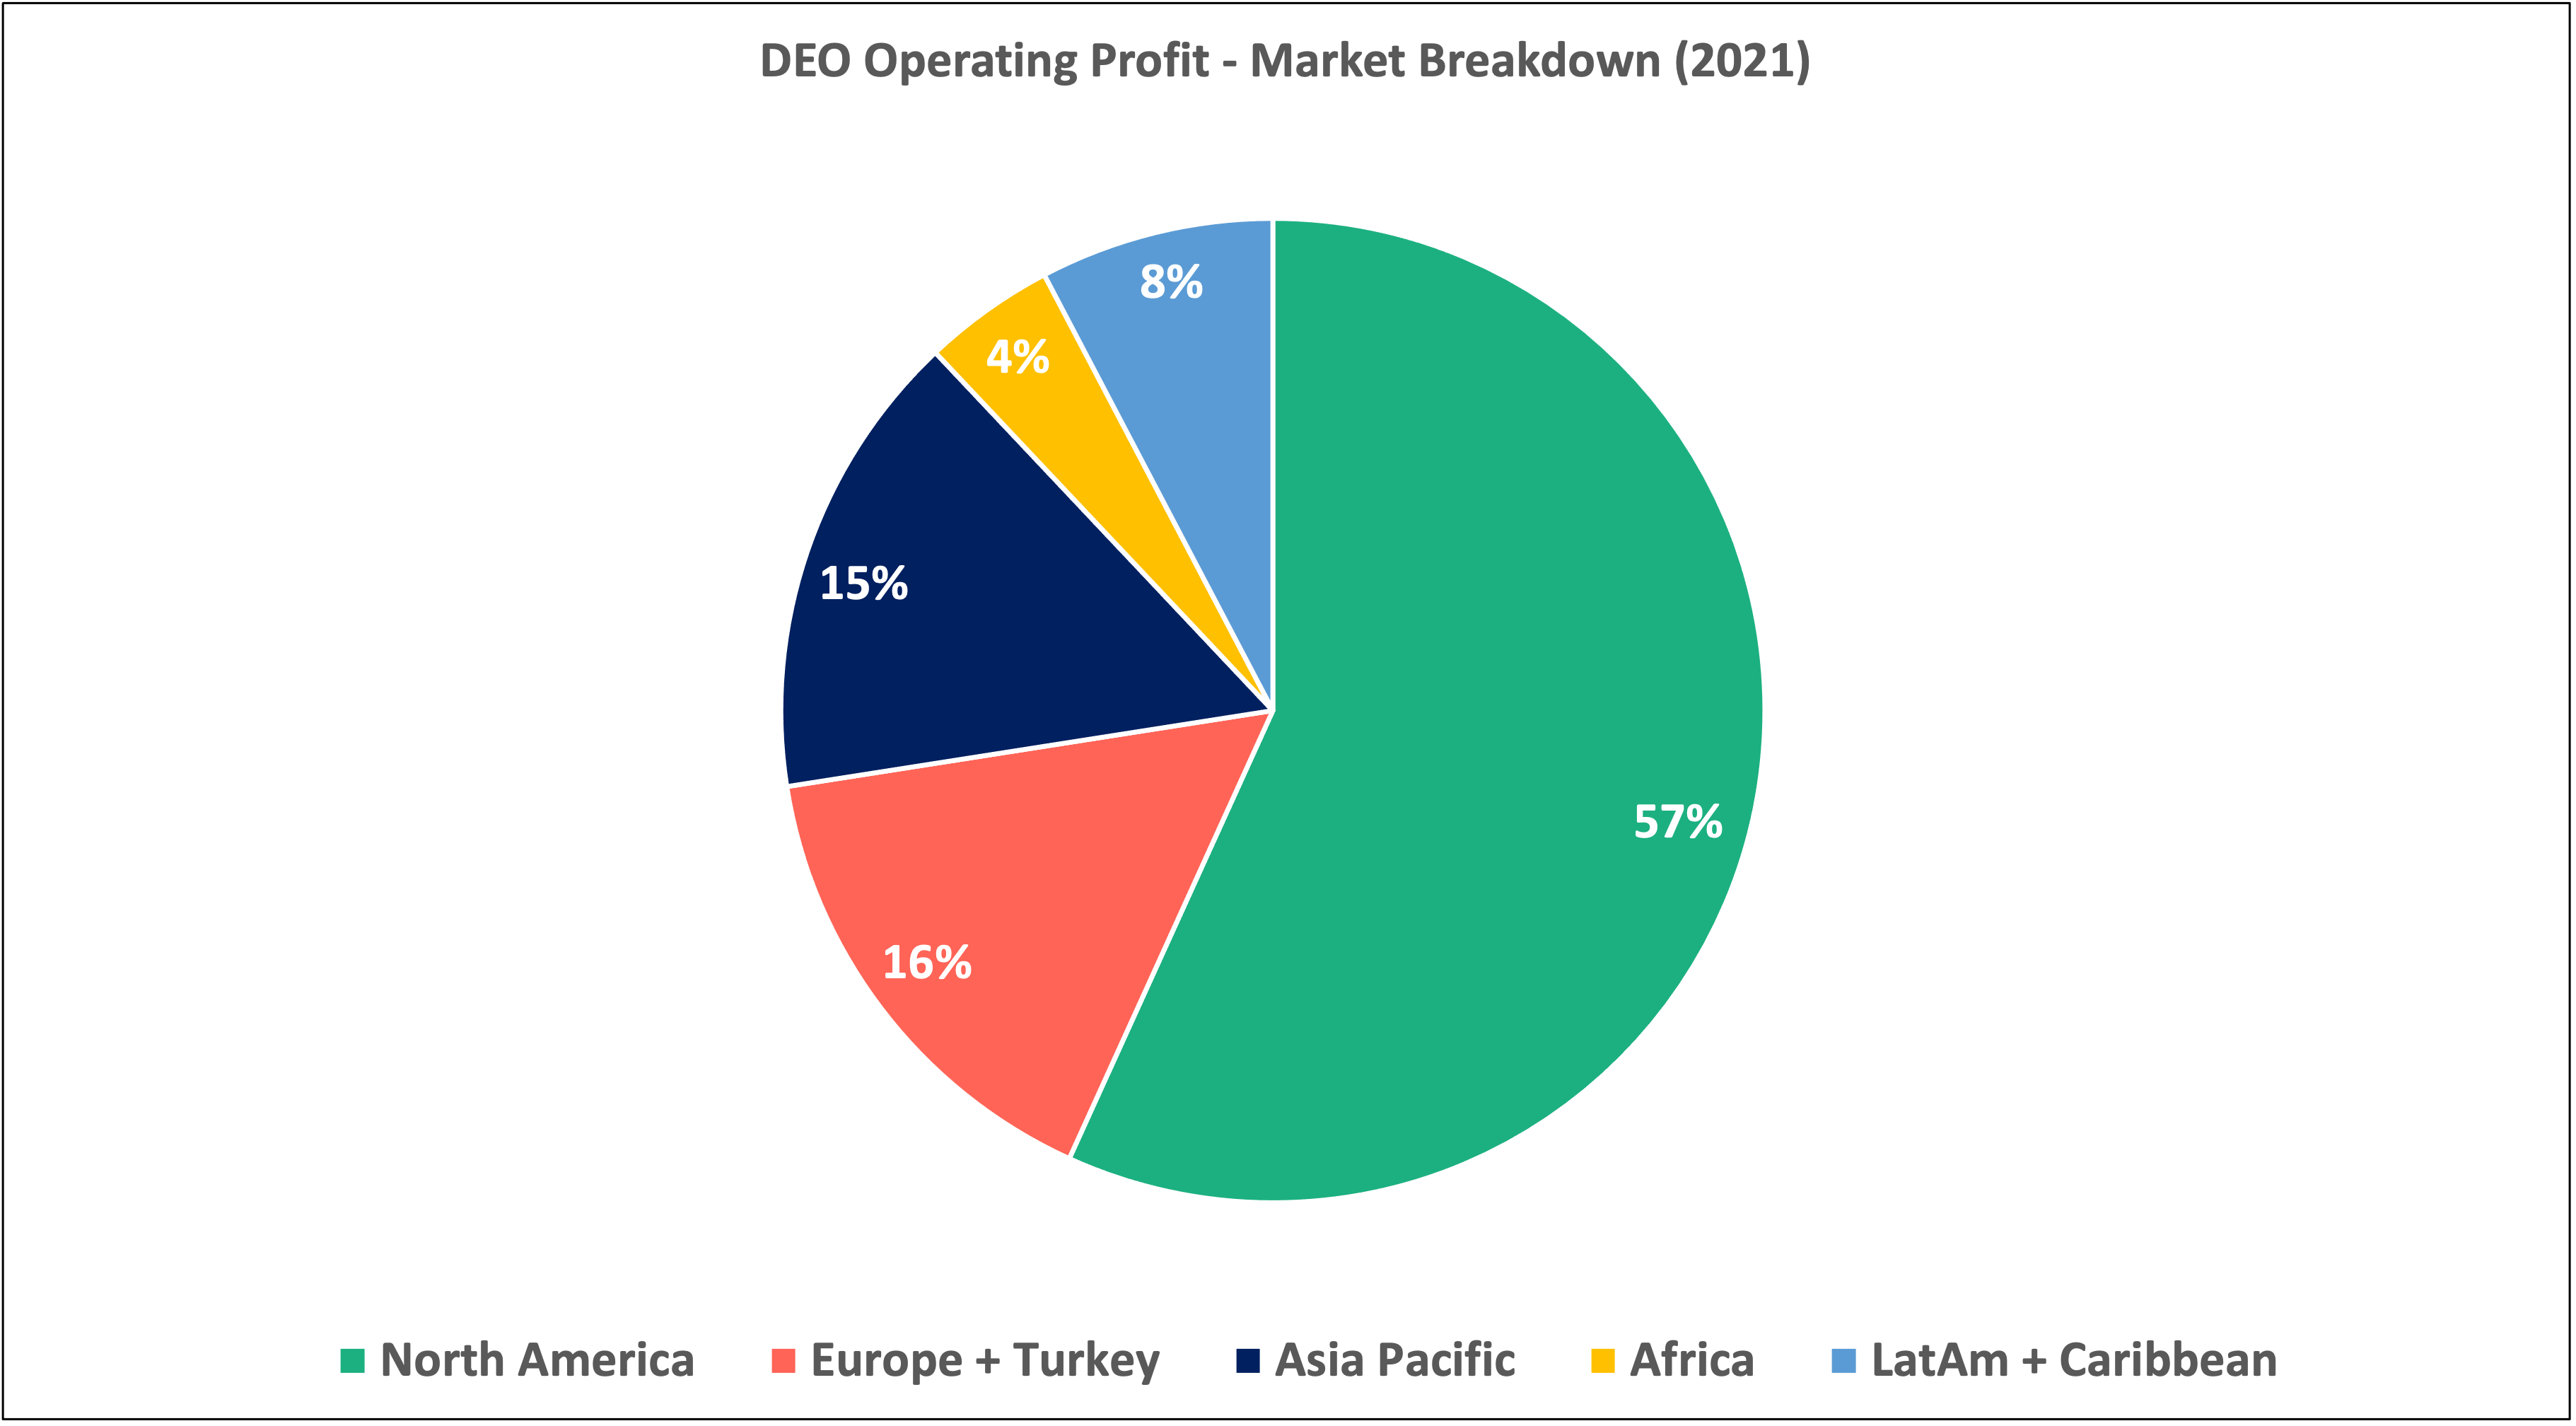
Markets. Diageo divides its markets into five geographic areas (in order of net sales): North America (41%), Europe & Turkey (20%), Asia Pacific (20%), Africa (11%), and Latin America & Caribbean (8%). In all of these markets but one, spirits are responsible for a large majority of the company’s sales (Africa is the exception with Diageo’s beer brands accounting for a majority of sales there).
The company expects ~600 million new legal purchase age consumers to enter the market globally by 2031.
China now accounts for just over 5% of net sales. “China” is mentioned sixty times in the company’s 2021 annual report/10-K. “United States” is mentioned 119 times.
Diageo has not been sleeping on e-commerce. Its products dominate Drizly’s (an alcohol delivery business owned by Uber) top-selling brands. The company owns five of the top ten spirits brands sold on the platform, including two of the top three. And on China’s largest platform, T-Mall, Diageo is the market leader in whiskey, holding a 24% market share. Globally, online sales of alcohol across the industry make up ~7% of the market, up from ~3% in 2018.
Strategy. While the spirits category has been growing at a good clip, management has noted that premium brand, higher price spirits are growing volumes much faster than the total spirits category. Higher price spirits tiers grew nine times faster than the total spirits category from 2010 to 2020. From Diageo’s 2021 annual report:
When it comes to beverage alcohol, consumers are ‘drinking better, not more’ – increasingly choosing brands and categories that offer superior quality, authenticity and taste. This premiumisation trend is supported by product innovation and fuelled by higher levels of prosperity and disposable income, coupled with a greater desire to explore new experiences, ingredients and serves for social occasions.
Thus, while the company’s approach is largely centered on brand diversification across the globe, ownership and acquisition of higher tier spirits brands is a top priority for management.
Acquisitions + divestitures. Diageo is a serial buyer and seller of alcohol businesses. Management looks for opportunities to sell lower-end brands and buy higher tier premium brands. Even when it does own a well-respected brand, management has not been afraid to sell it to make room for a higher tier acquisition that would help position the company for better long-term growth.
For example, in 2014, the company sold Old Bushmills Distillery in exchange for cash and ownership of the Don Julio tequila brand. The impetus behind the deal was Diageo’s desire to (1) increase its exposure to Mexico’s fast-growing spirits market and (2) swap out a lower tier premium spirits brand with a higher tier one (a bottle of Don Julio sells for 2-3x the price of a bottle of Bushmills). Diageo has made additional moves over the years to focus its business on high-end spirits:
In 2015, Diageo sold almost all of its wine business.
In 2018, the company sold 19 lower-tier brands to Sazerac, a privately-held alcohol company that owns many non-premium and lower tier premium brands.
In 2019, the company sold United National Breweries, a South African beer producer that it had bought just four years earlier.
All the while, Diageo has steadily bolstered its investments in higher tier spirits brands such as Casamigos (U.S.), Sichuan Shuijingfang Company (China), and Stauning (Denmark).
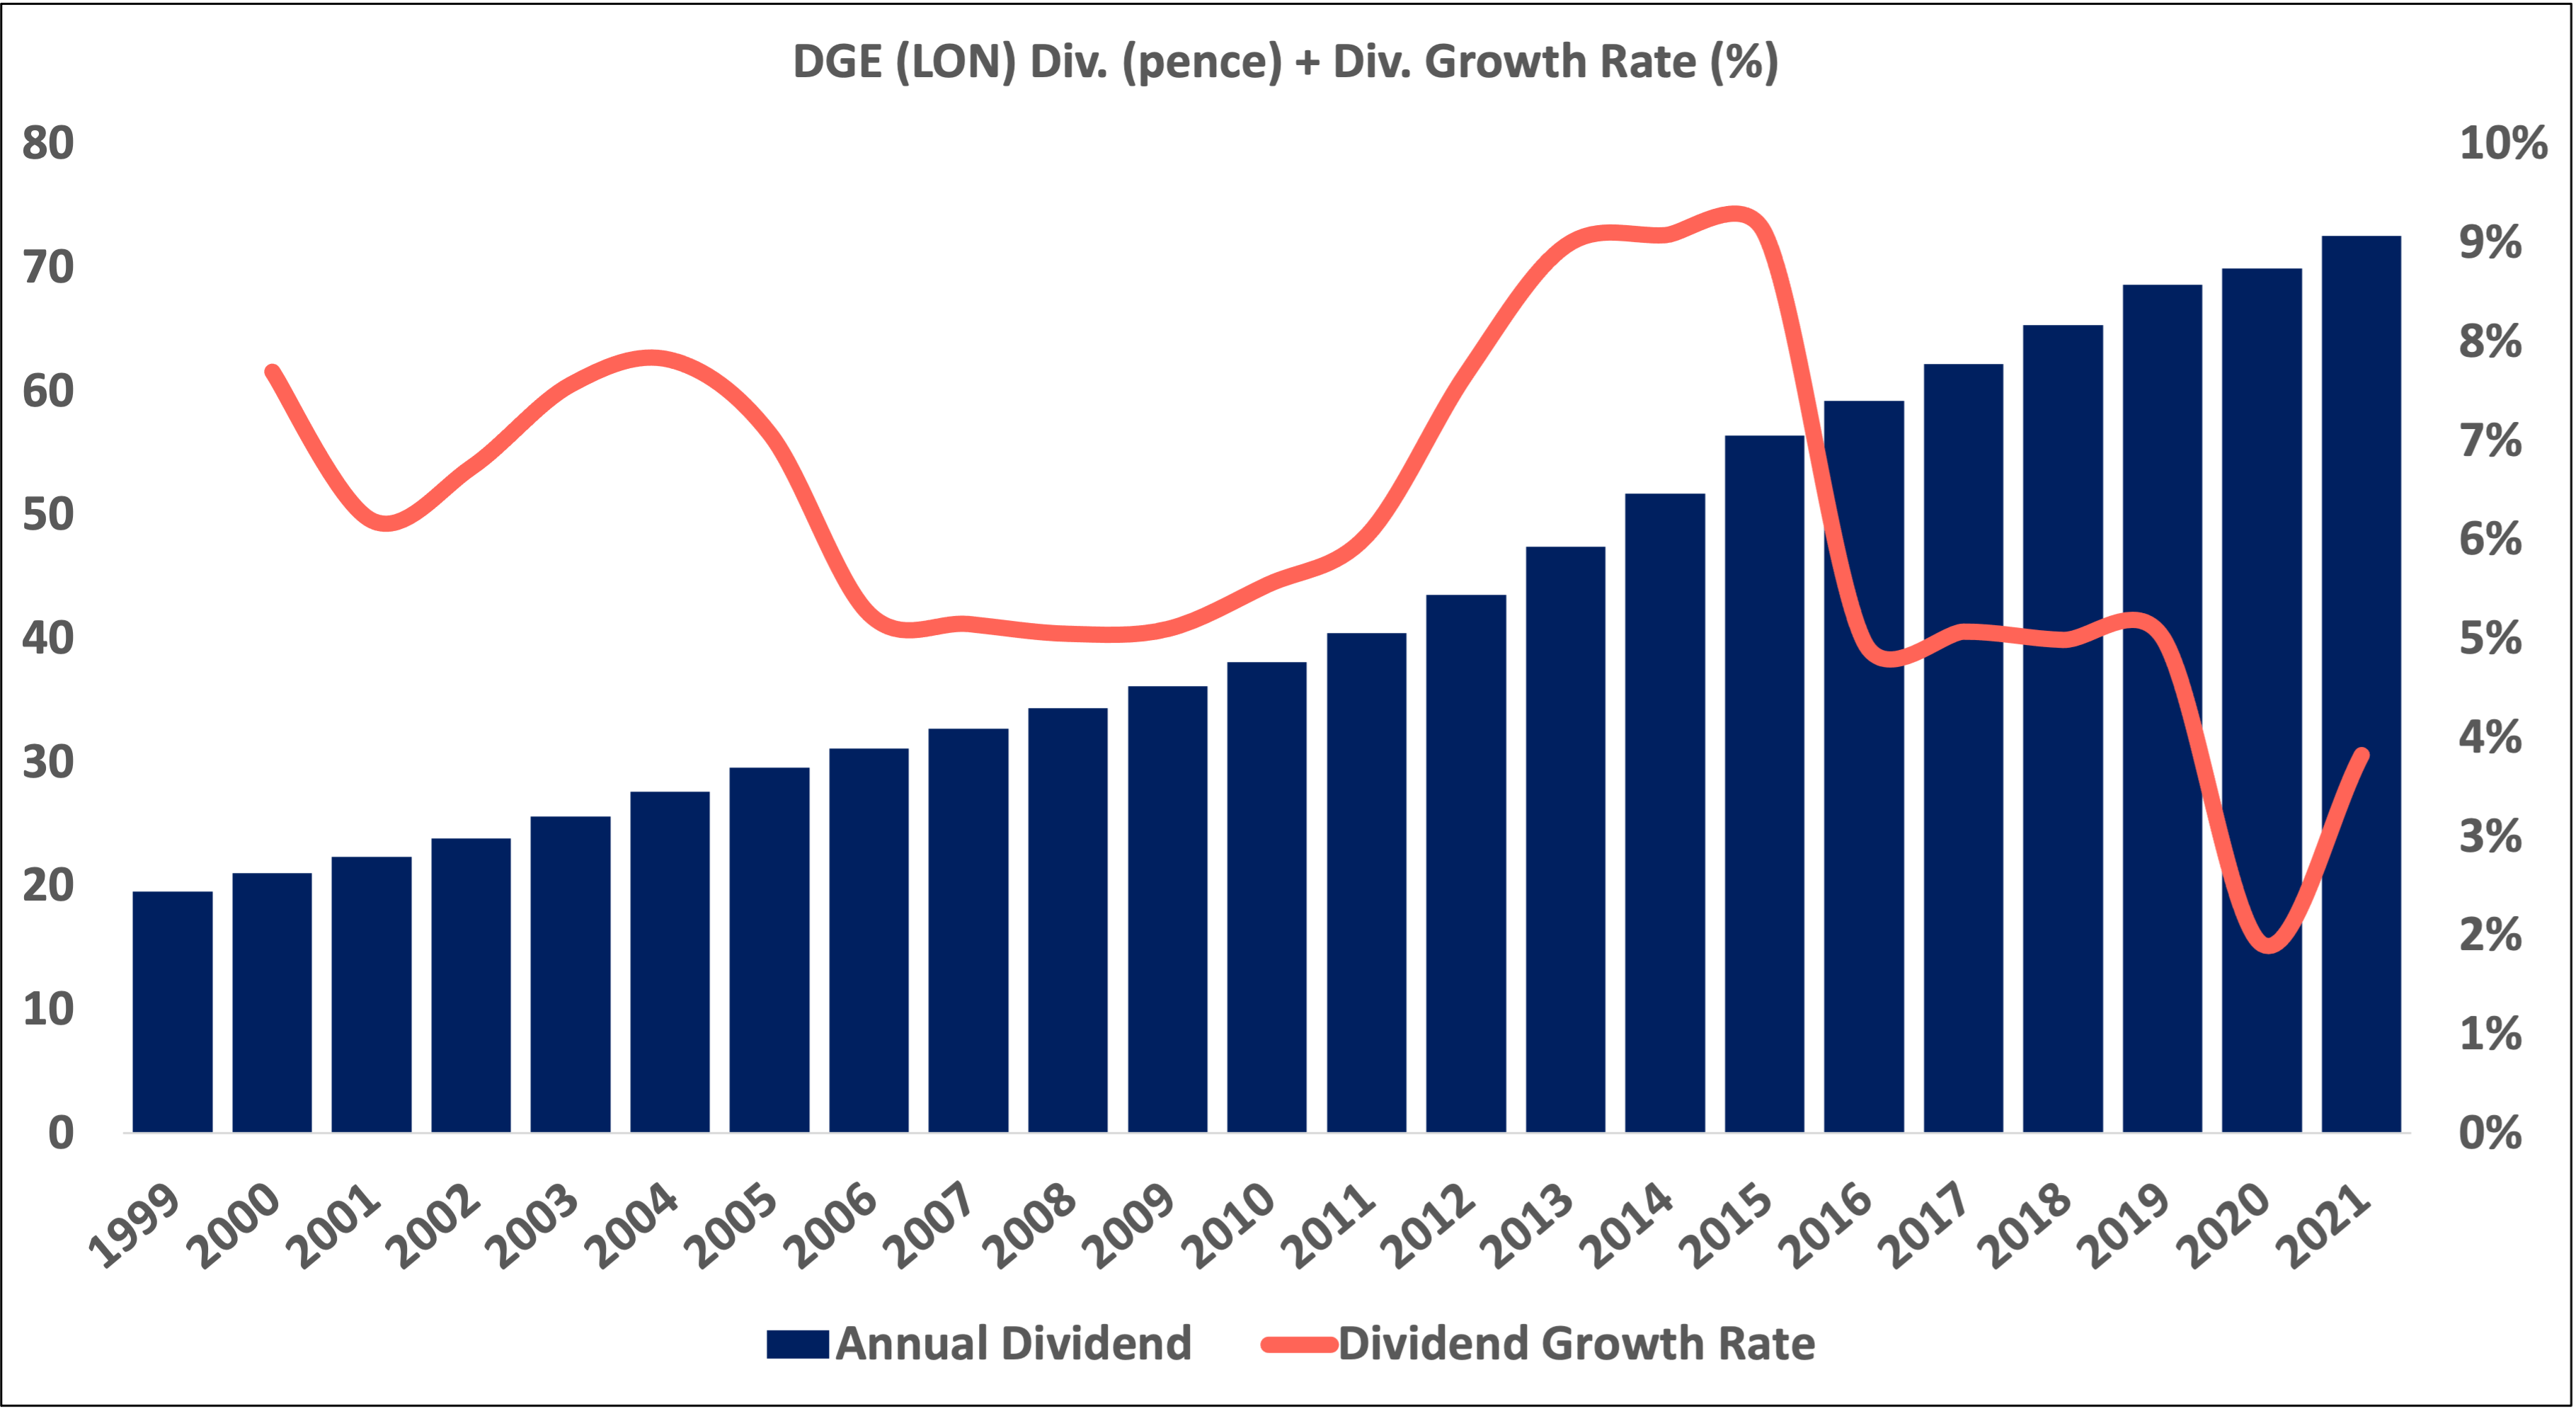
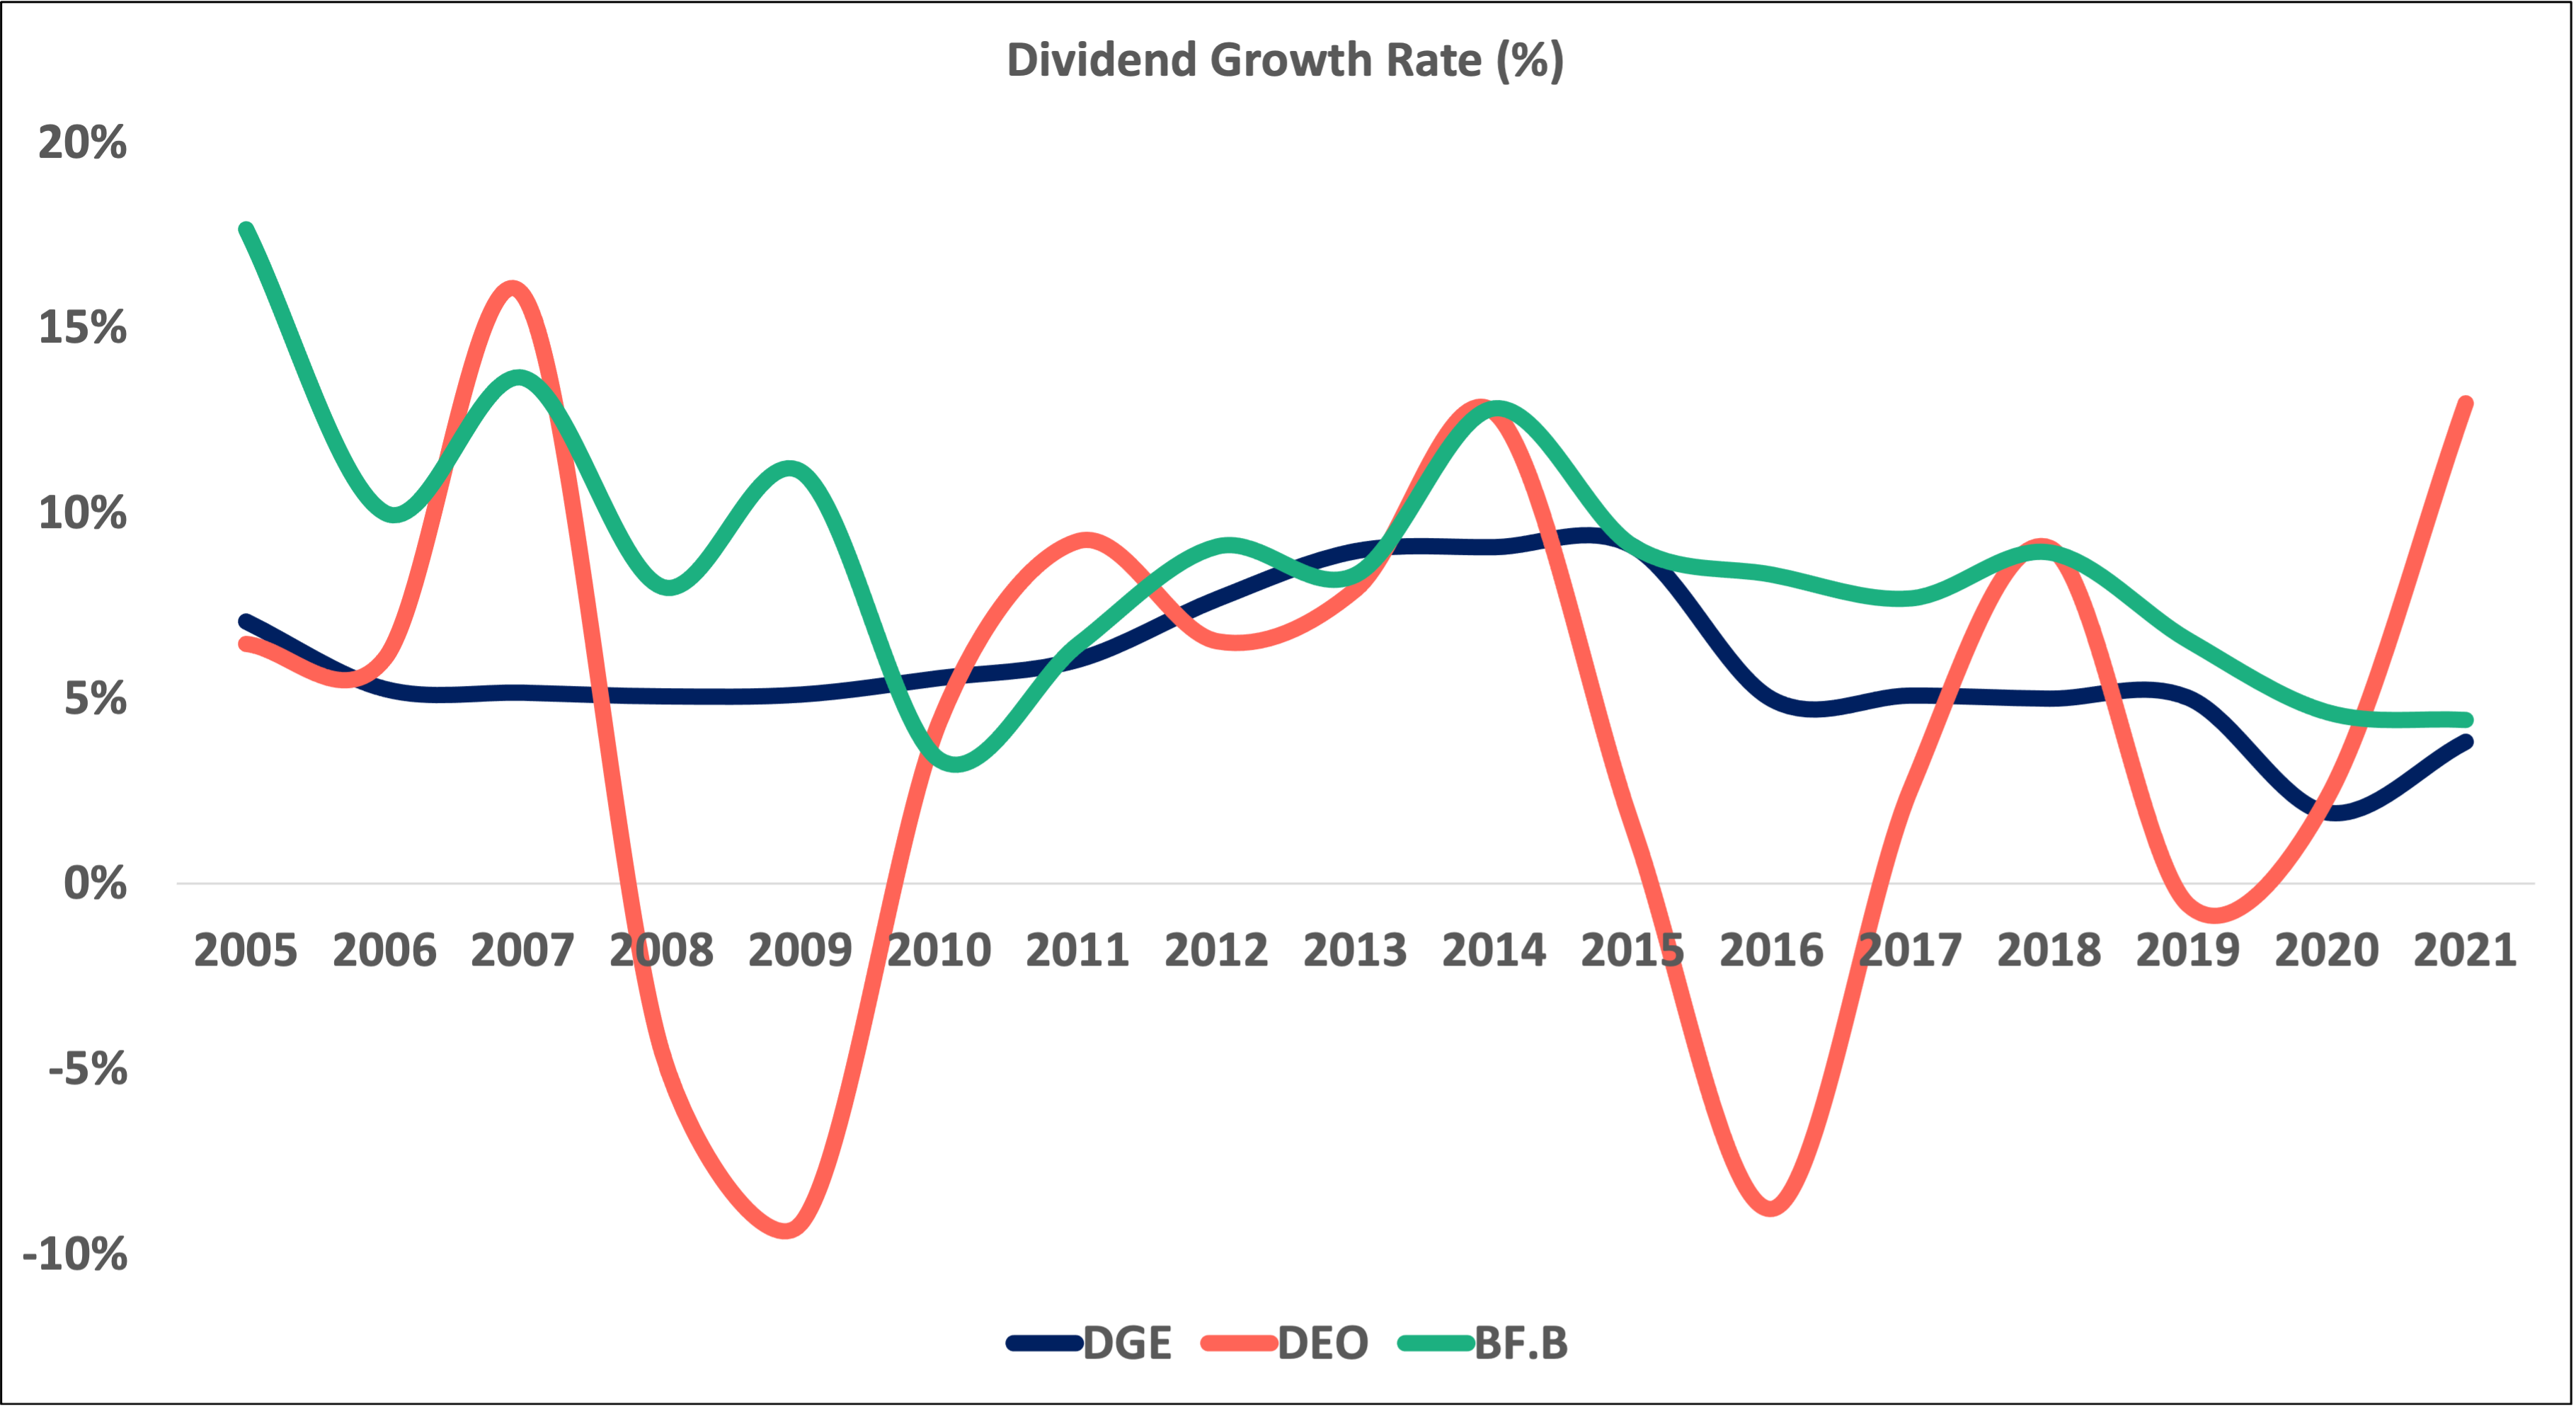
Capital allocation. Diageo targets a ratio of earnings-(excluding exceptional items)-to-dividend of between 1.8 and 2.2 times. The company’s payout in pence (via the DGE shares) has been growing uninterrupted for over two decades. Those holding U.S.-listed shares (DEO) have experienced choppy dividend payouts due to changes in the pound-to-dollar exchange rate over the years. Even so, holders of DEO have also enjoyed healthy dividend growth over the last two decades. Since 2004, the dividend’s average annual growth rate has been 5.97% if you owned the London shares (DGE) and 5.27% if you owned the U.S. shares (DEO).
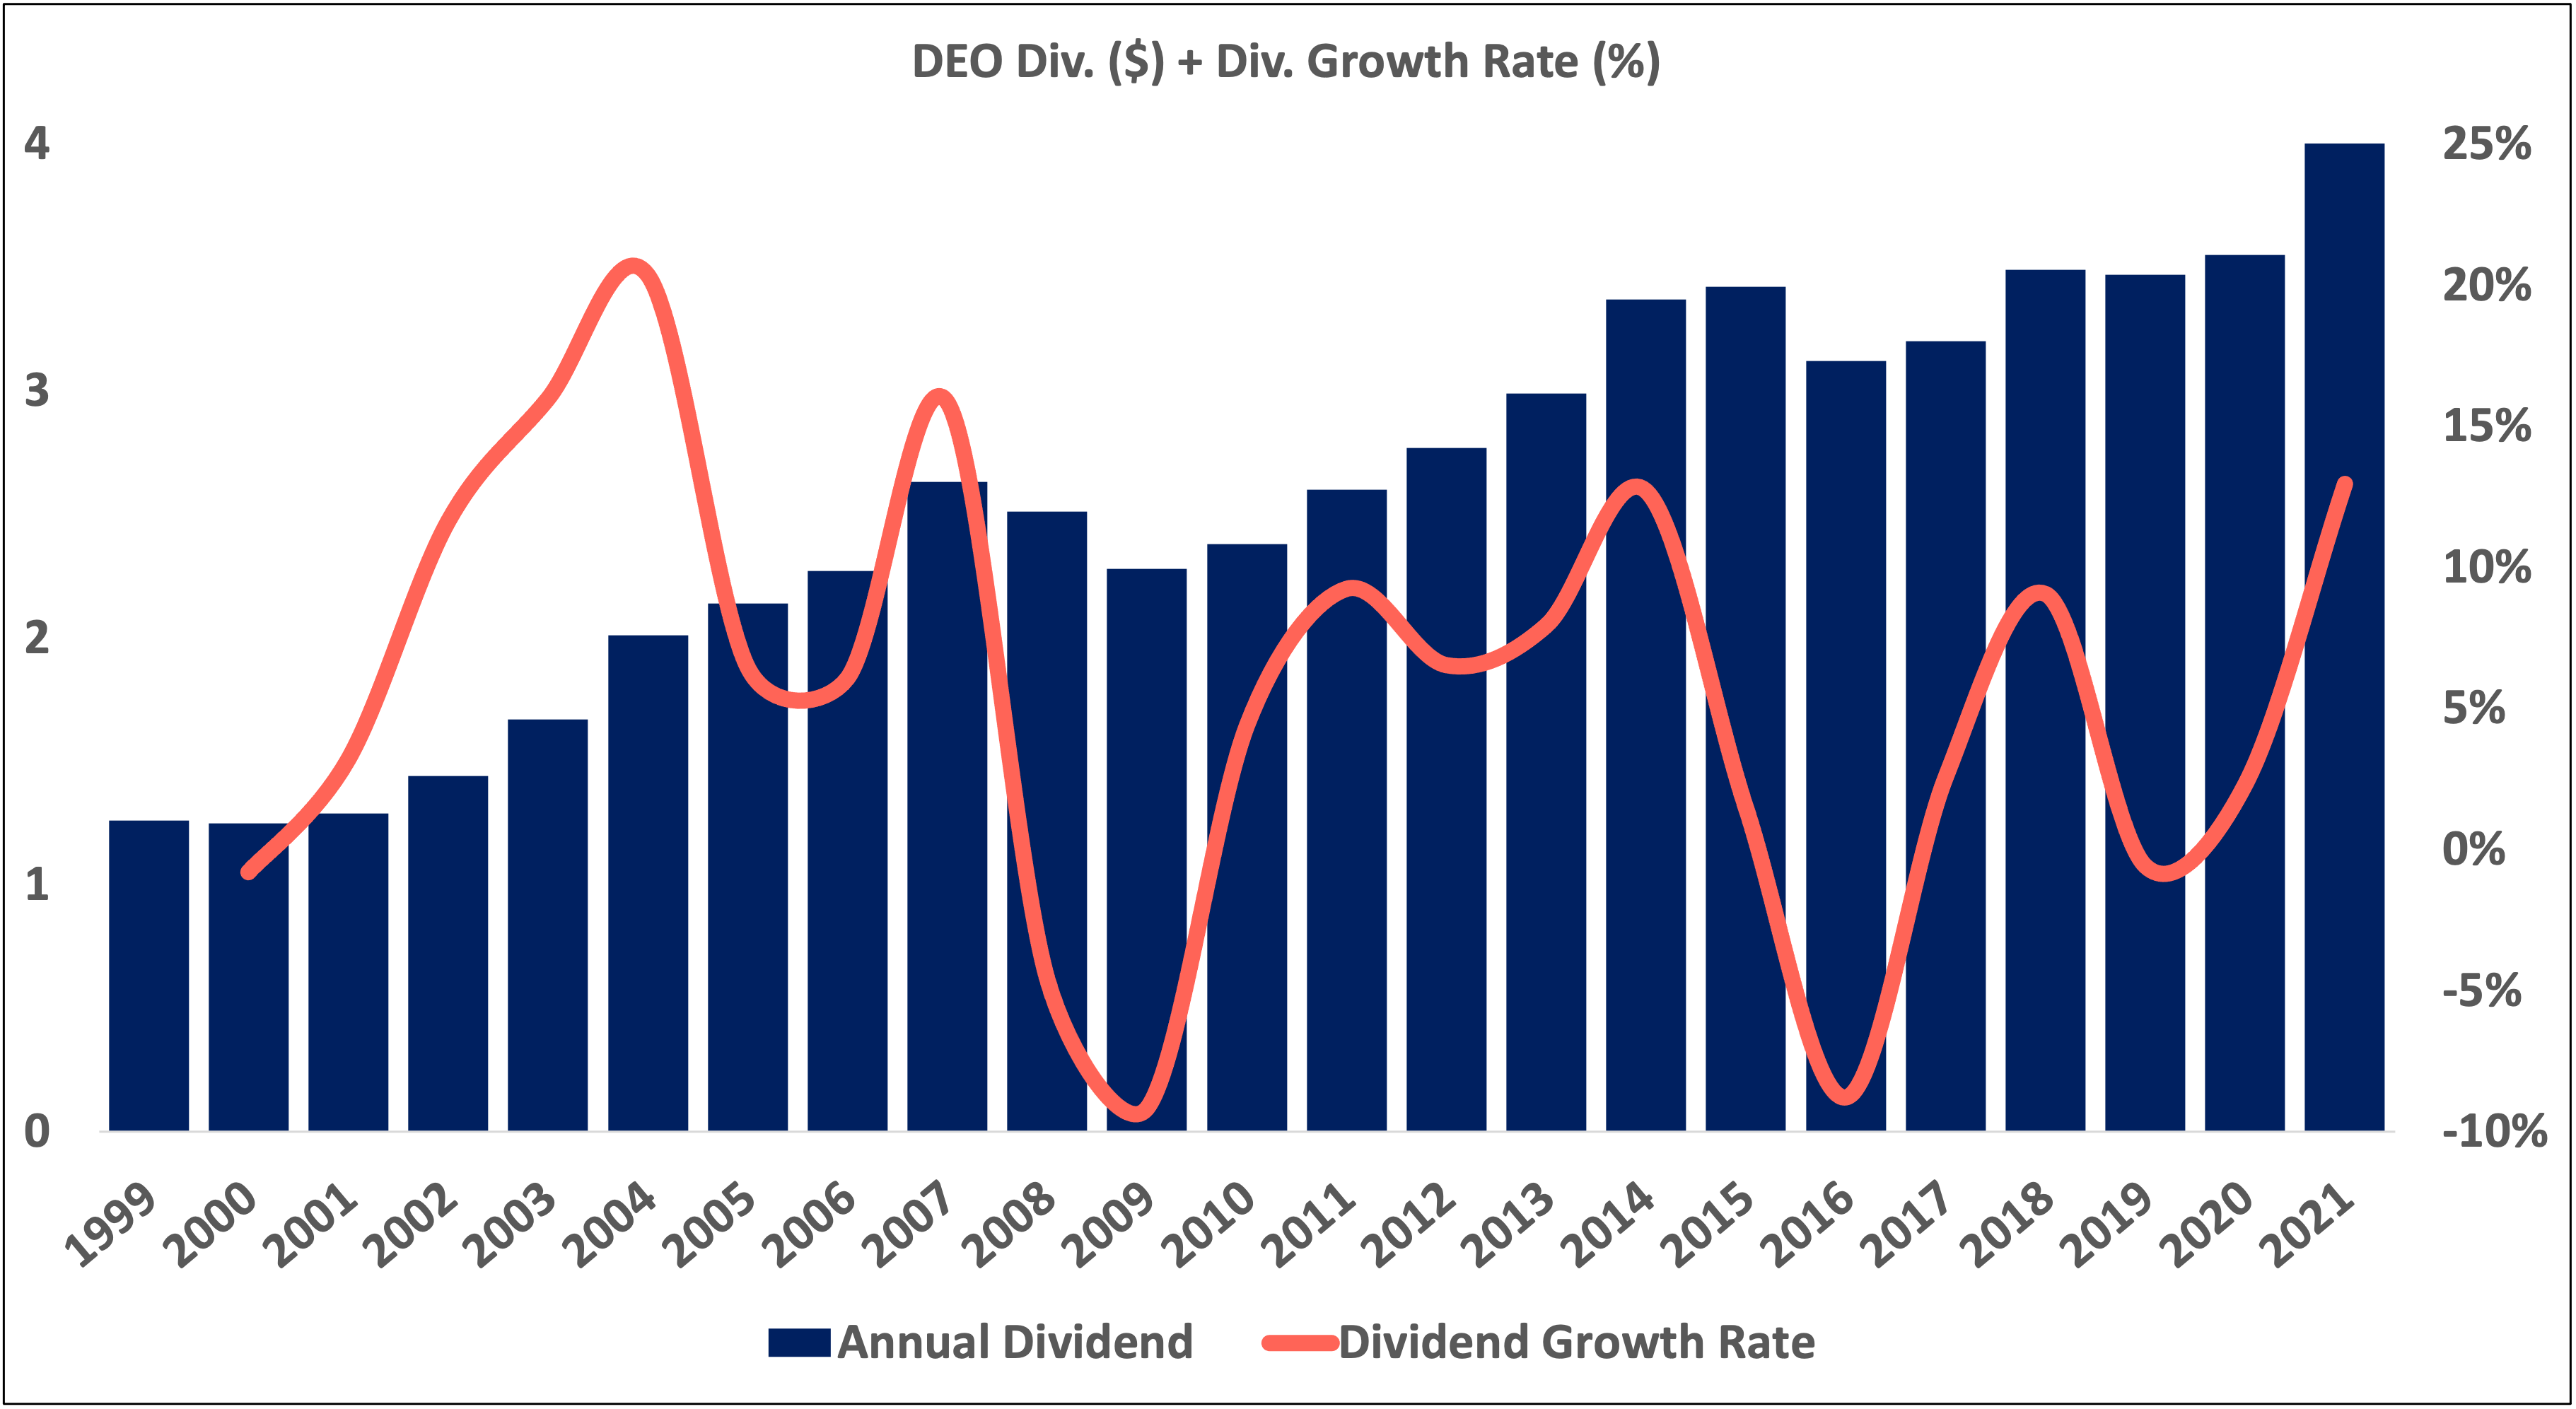
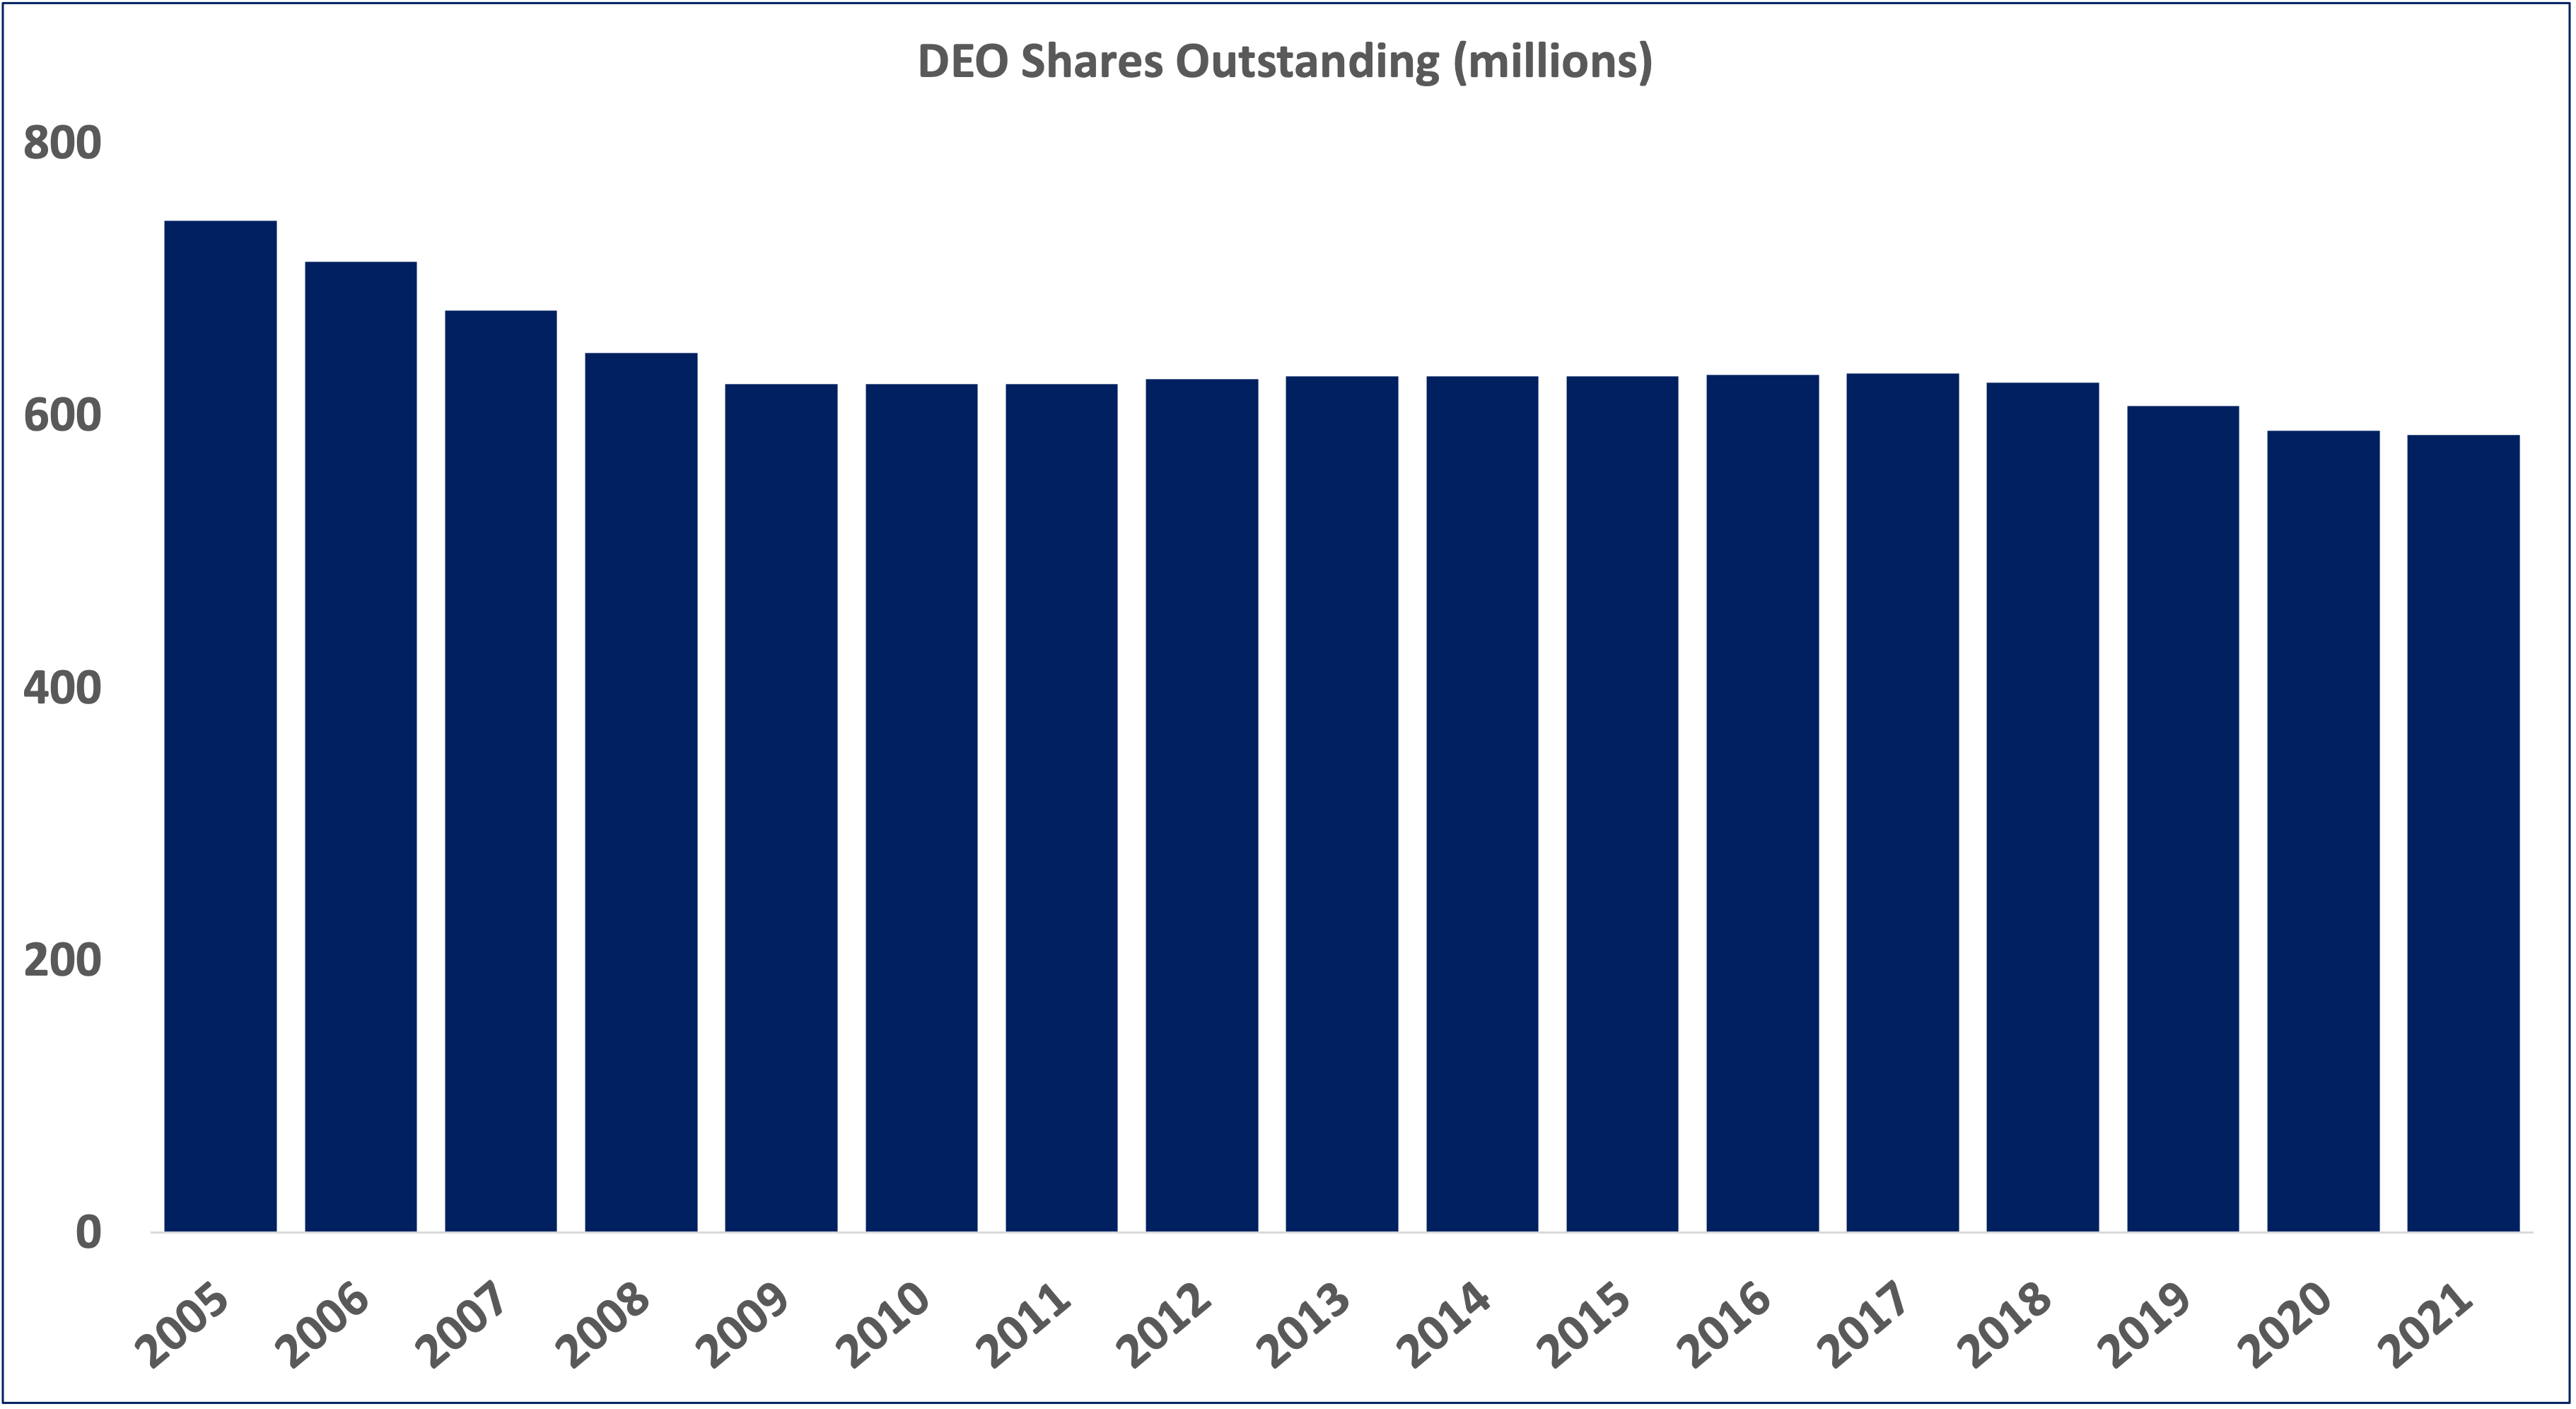
Management does not appear to be a big proponent of share buybacks. Outstanding shares have remained pretty flat since 2010. Management has said that buybacks are on the back-burner until the company’s debt is down to a more comfortable level.
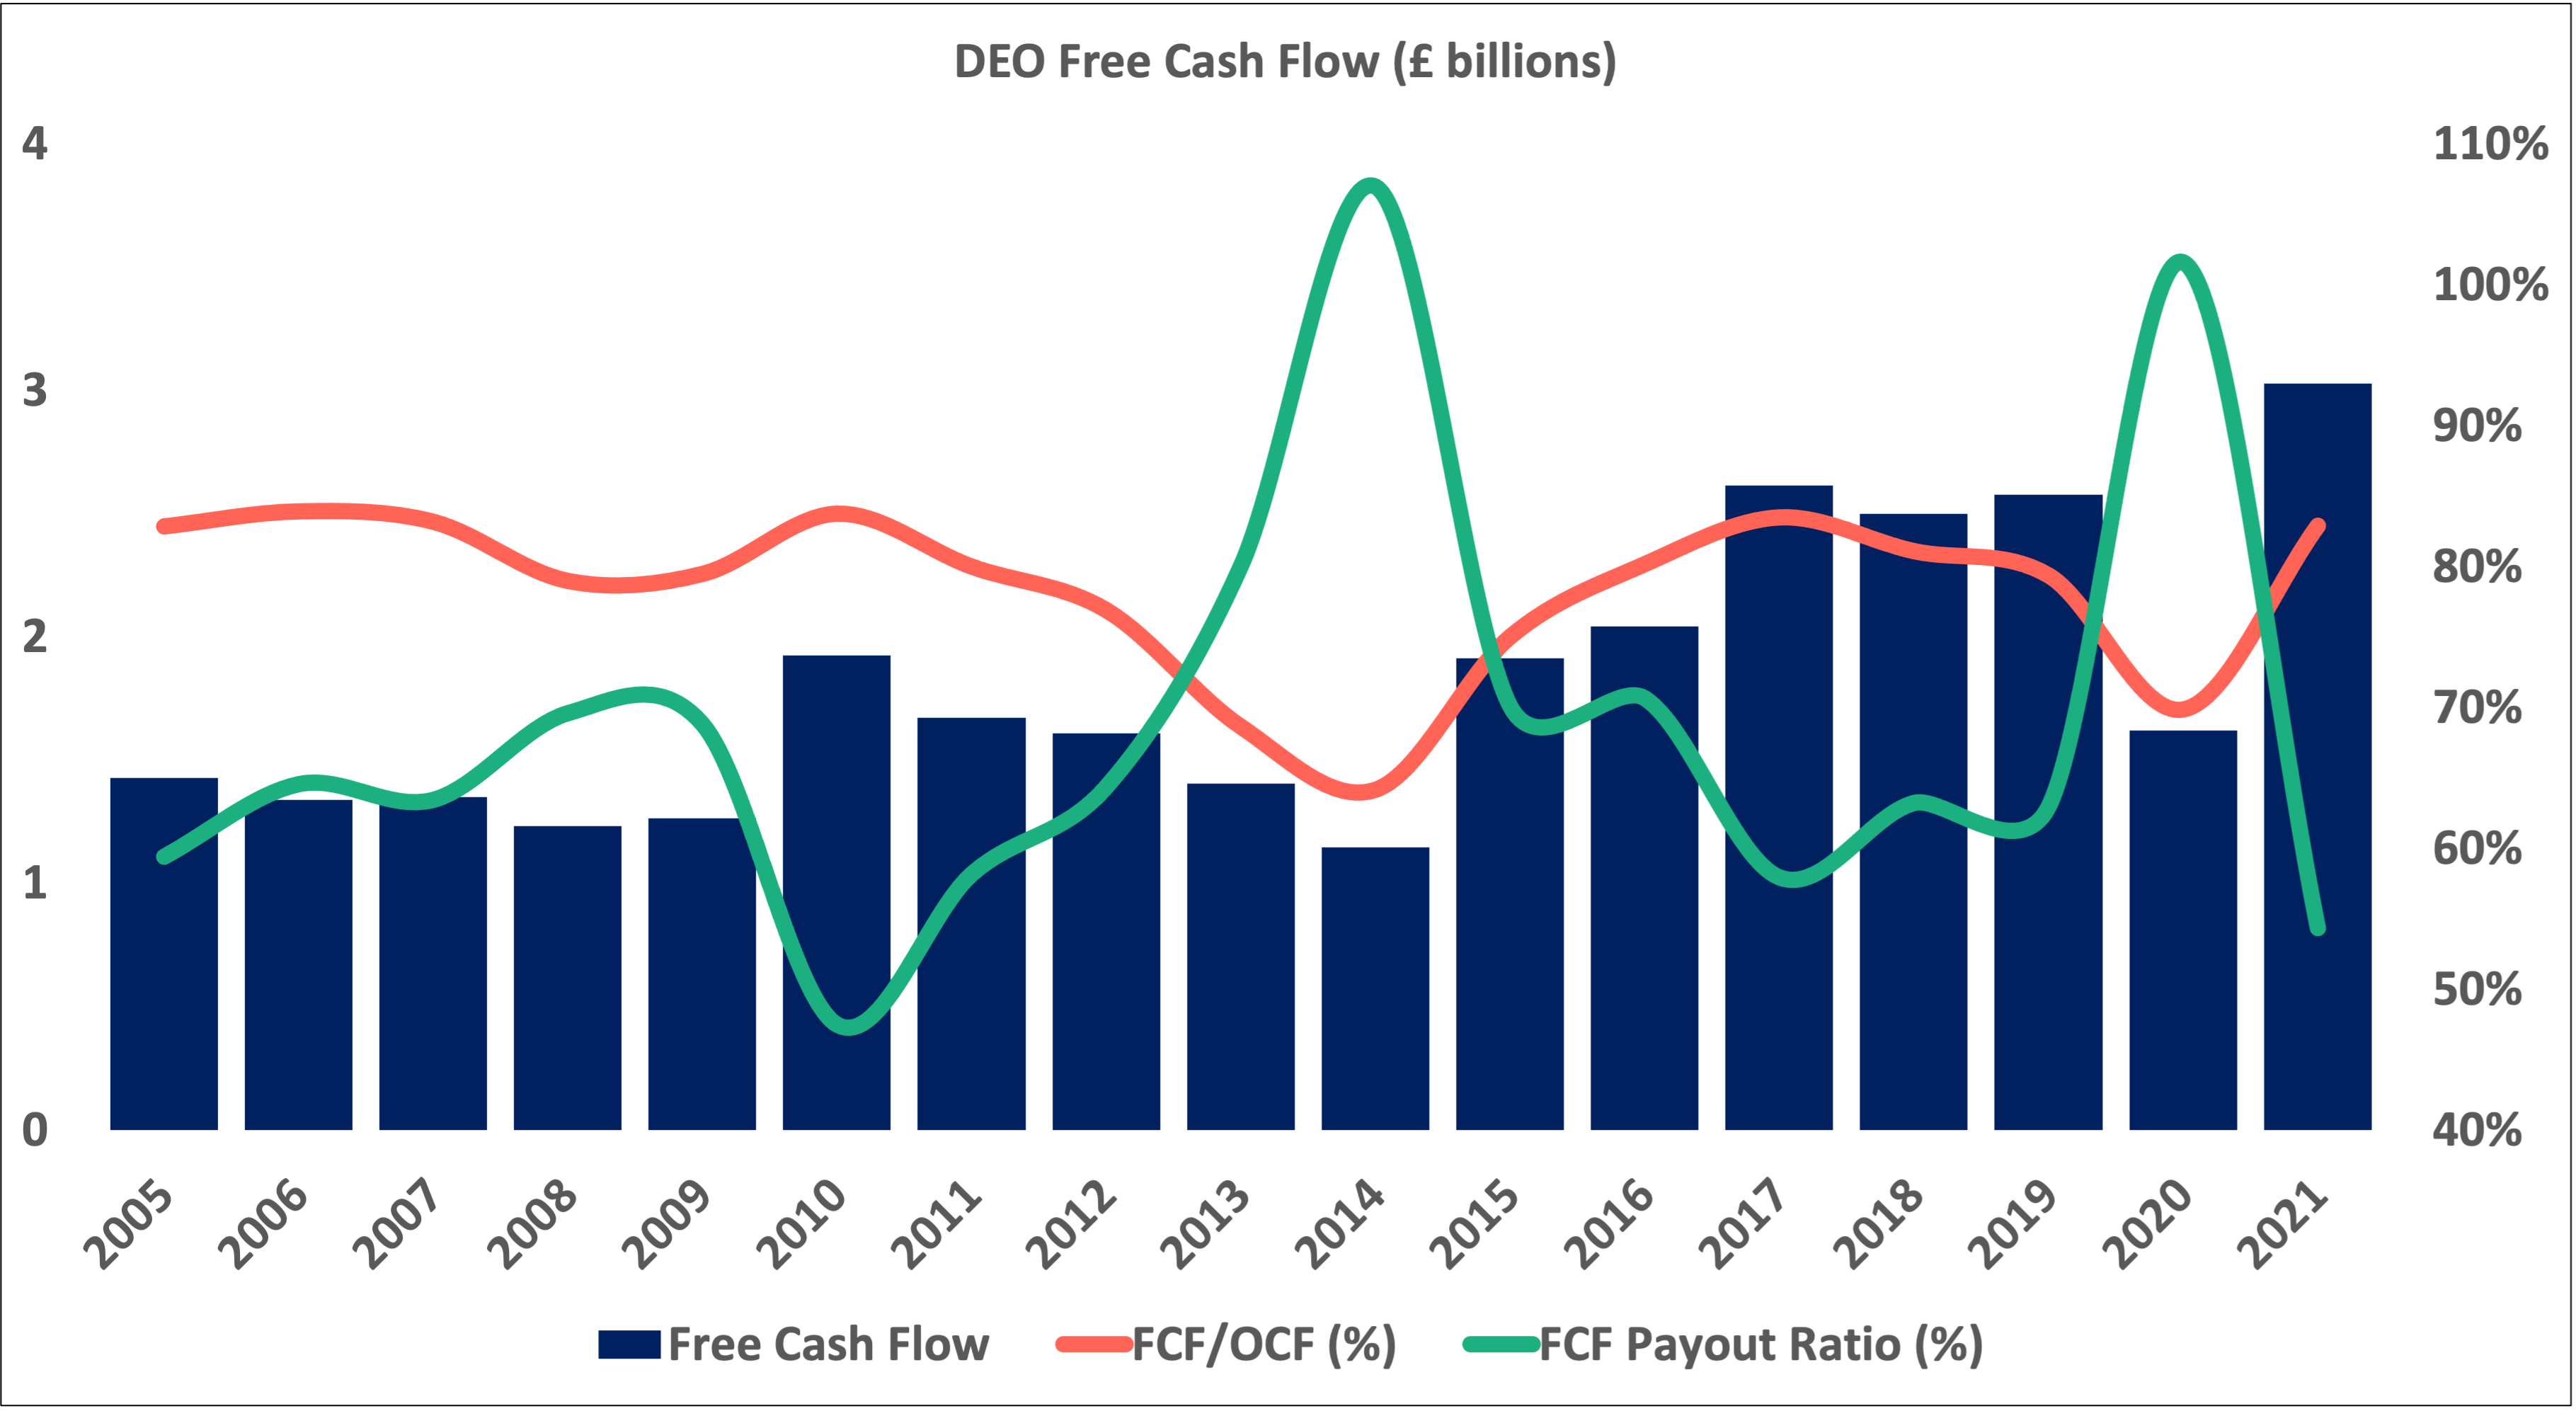
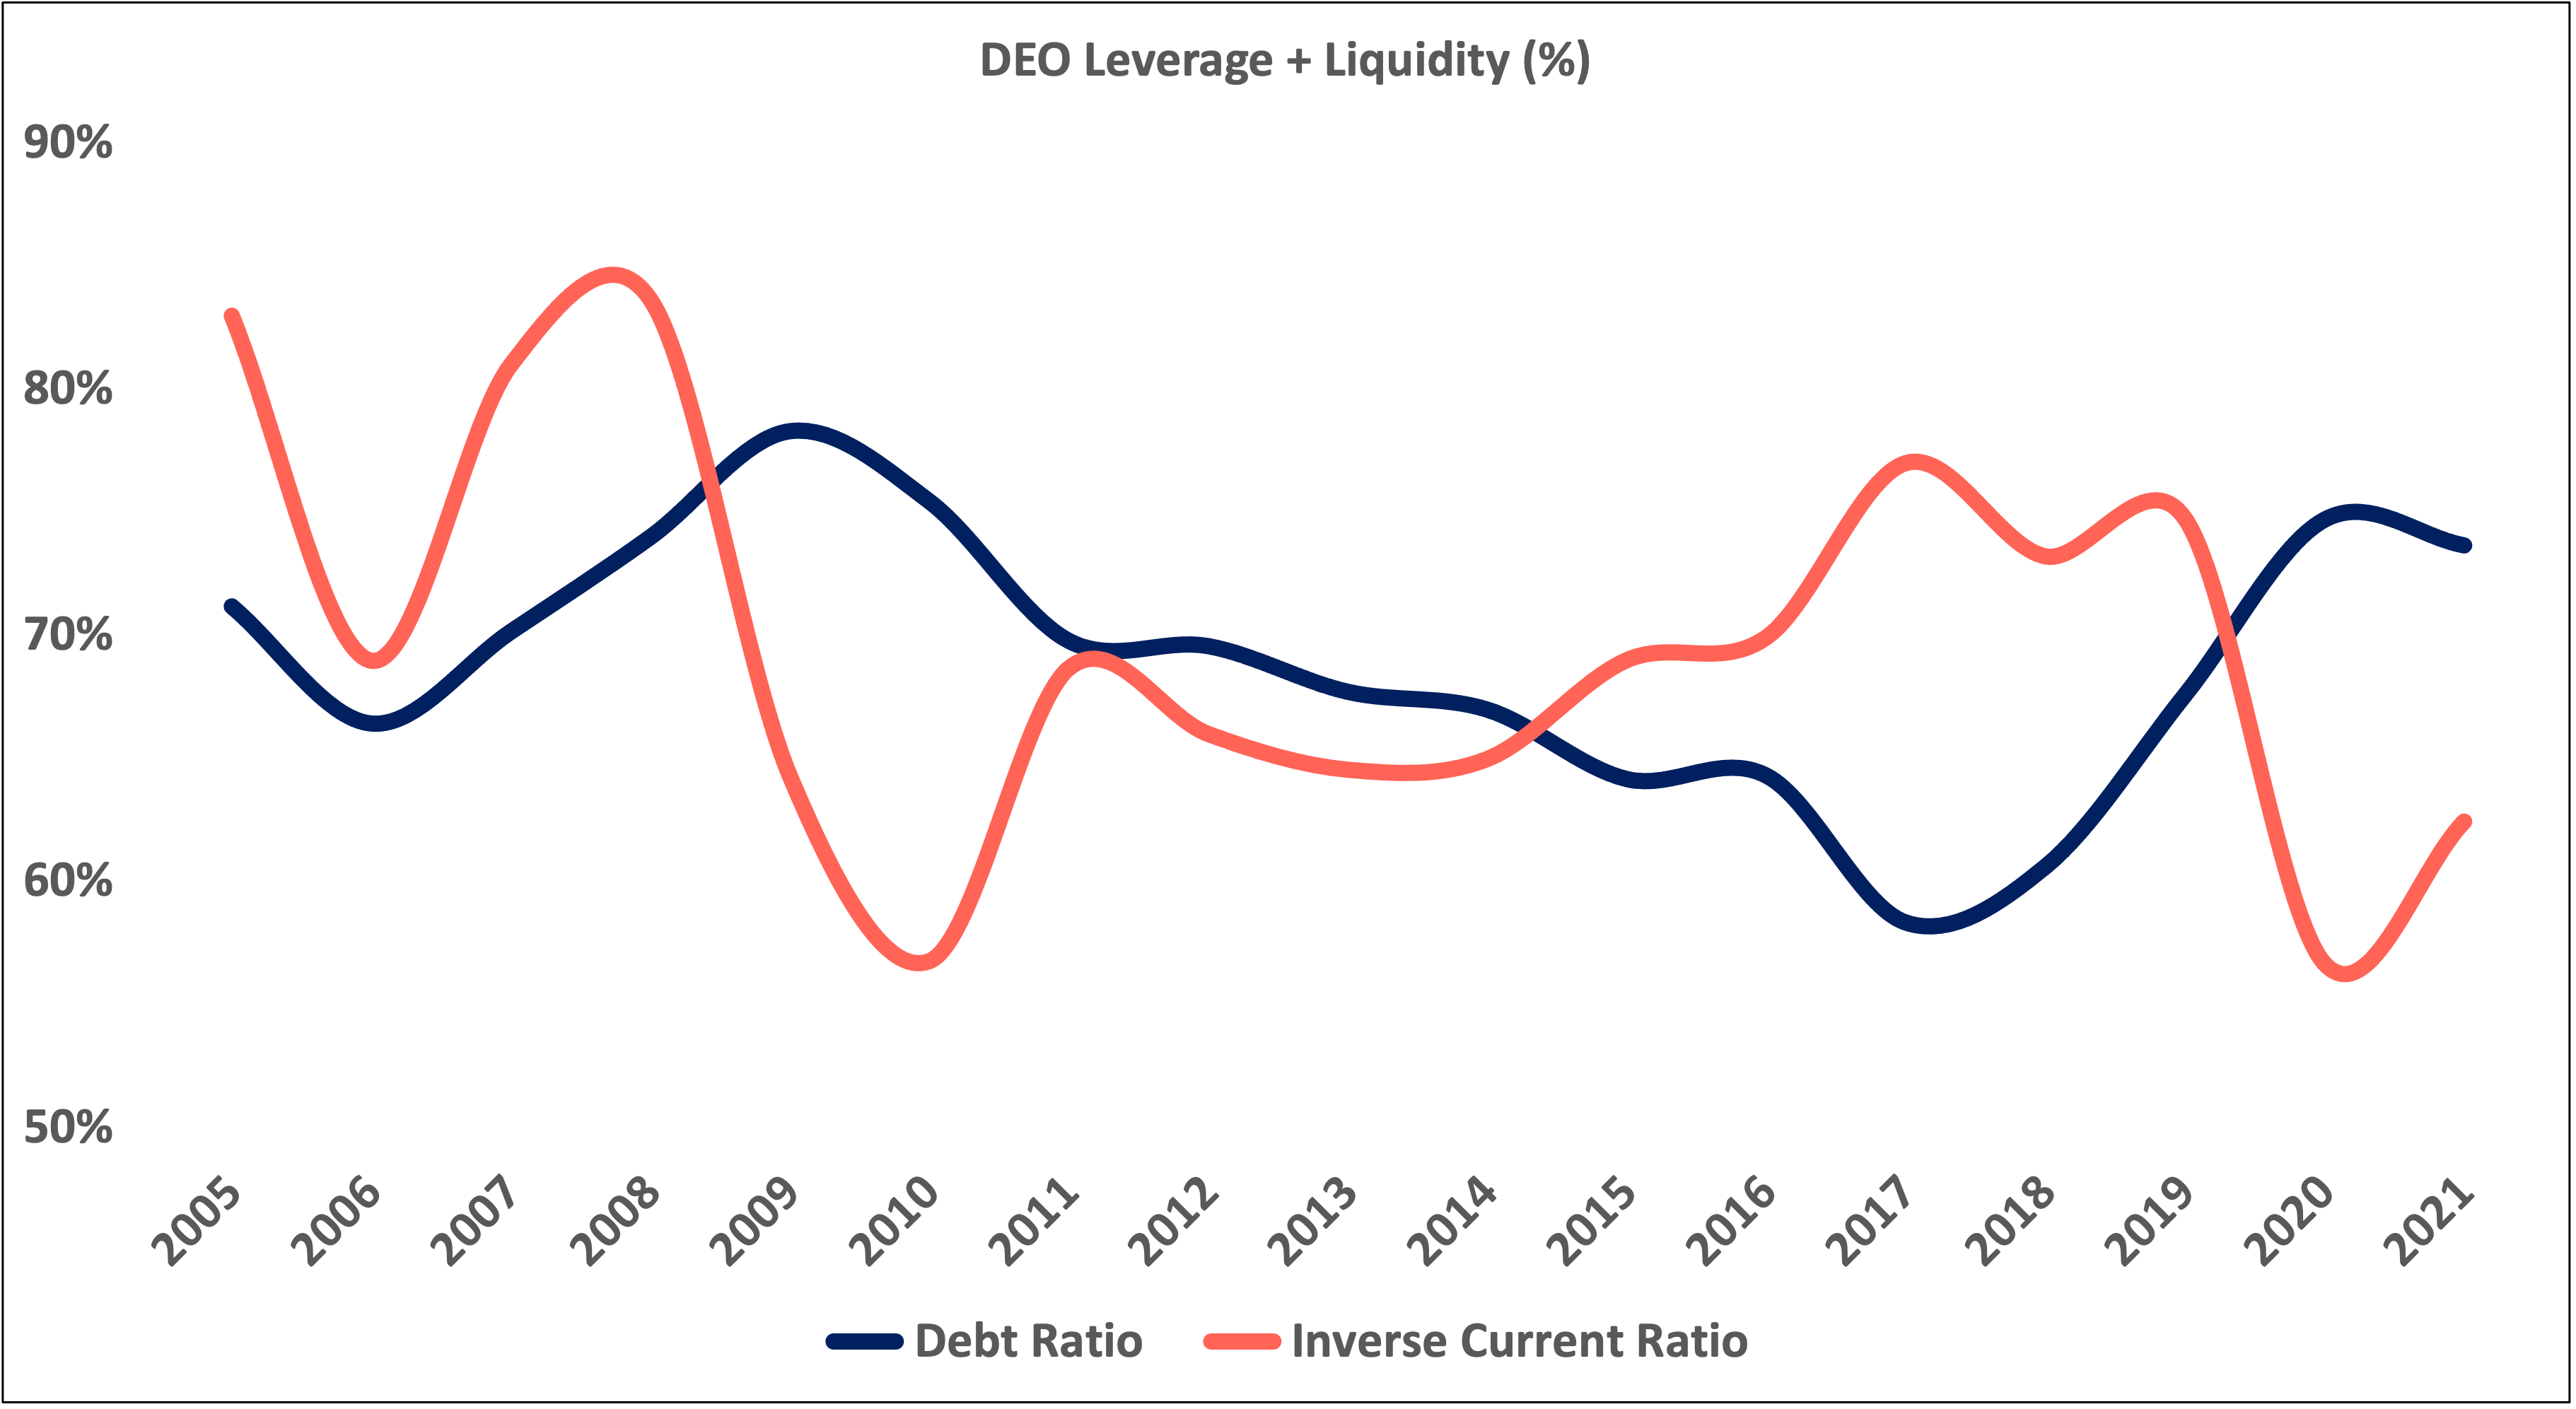
Leverage + liquidity. Current liabilities as a percent of current assets have remained at pretty safe levels throughout the company’s history. Keep in mind, though, current assets include inventory which is not necessarily always very liquid. Management likes to see debt as a percent of assets stay at or below 70%. Thus, for now, the company is directing free cash flow toward deleveraging rather than things like buy-backs.
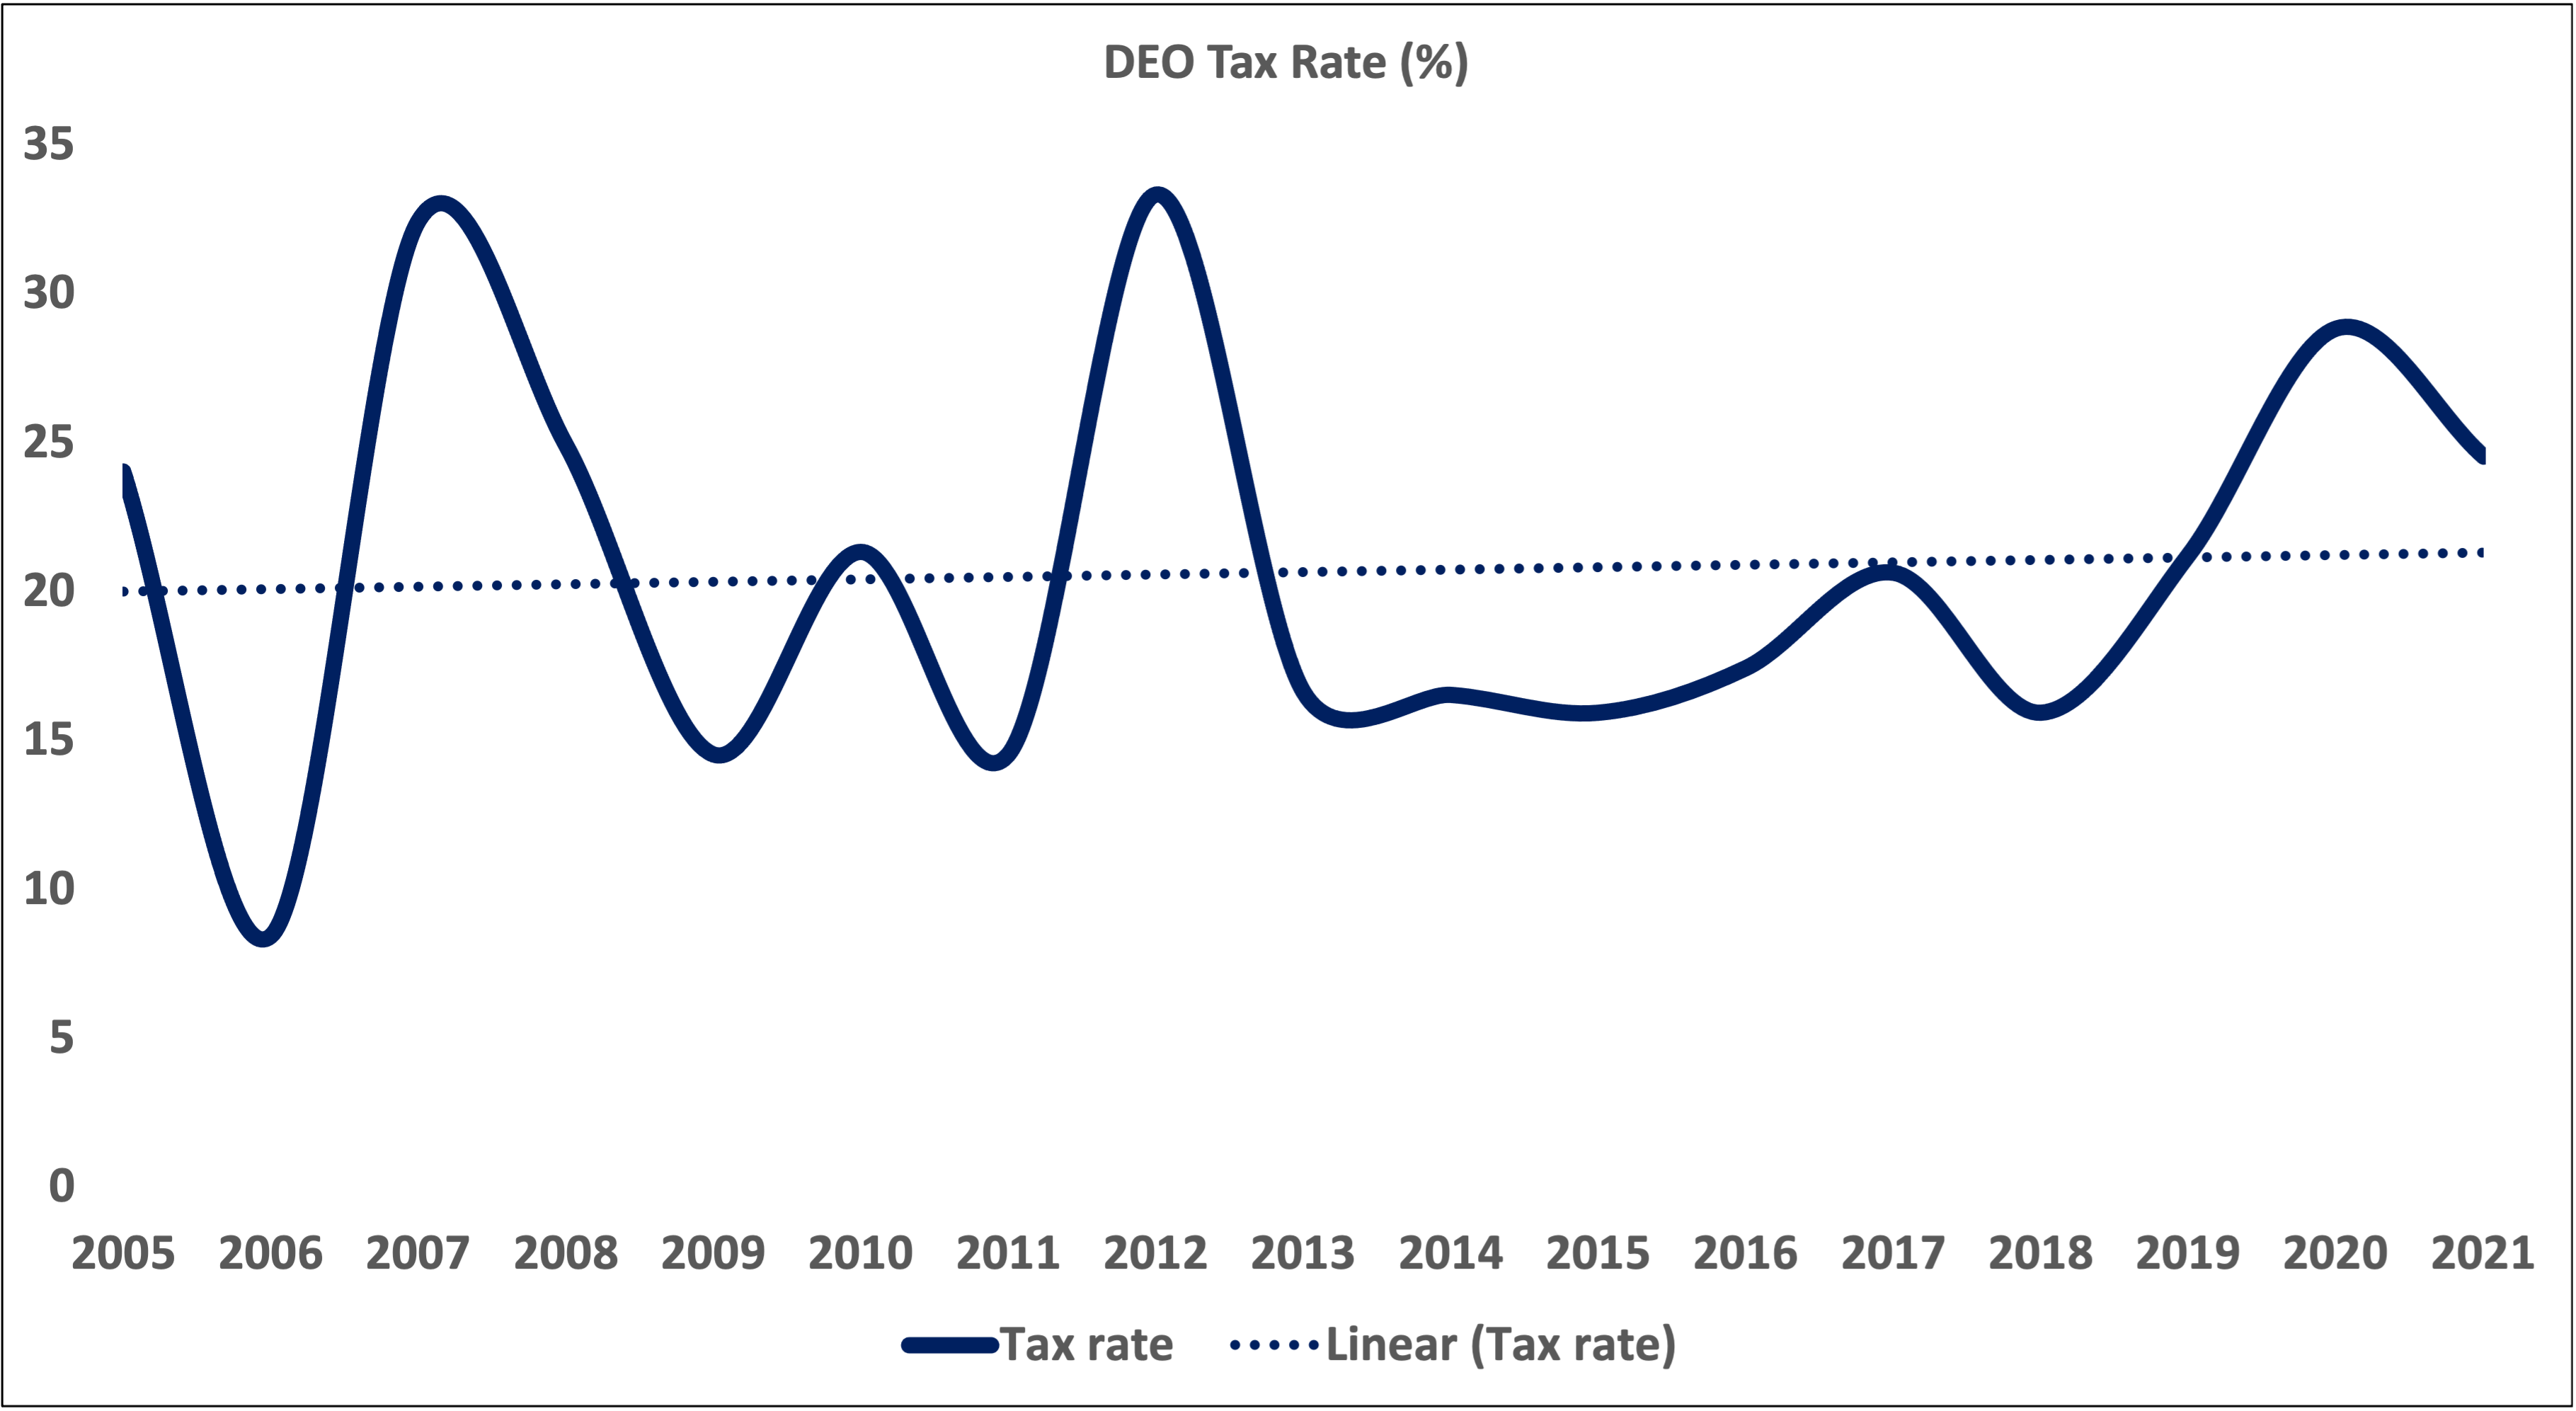
Taxes. The company’s tax rate is trending above 20%.
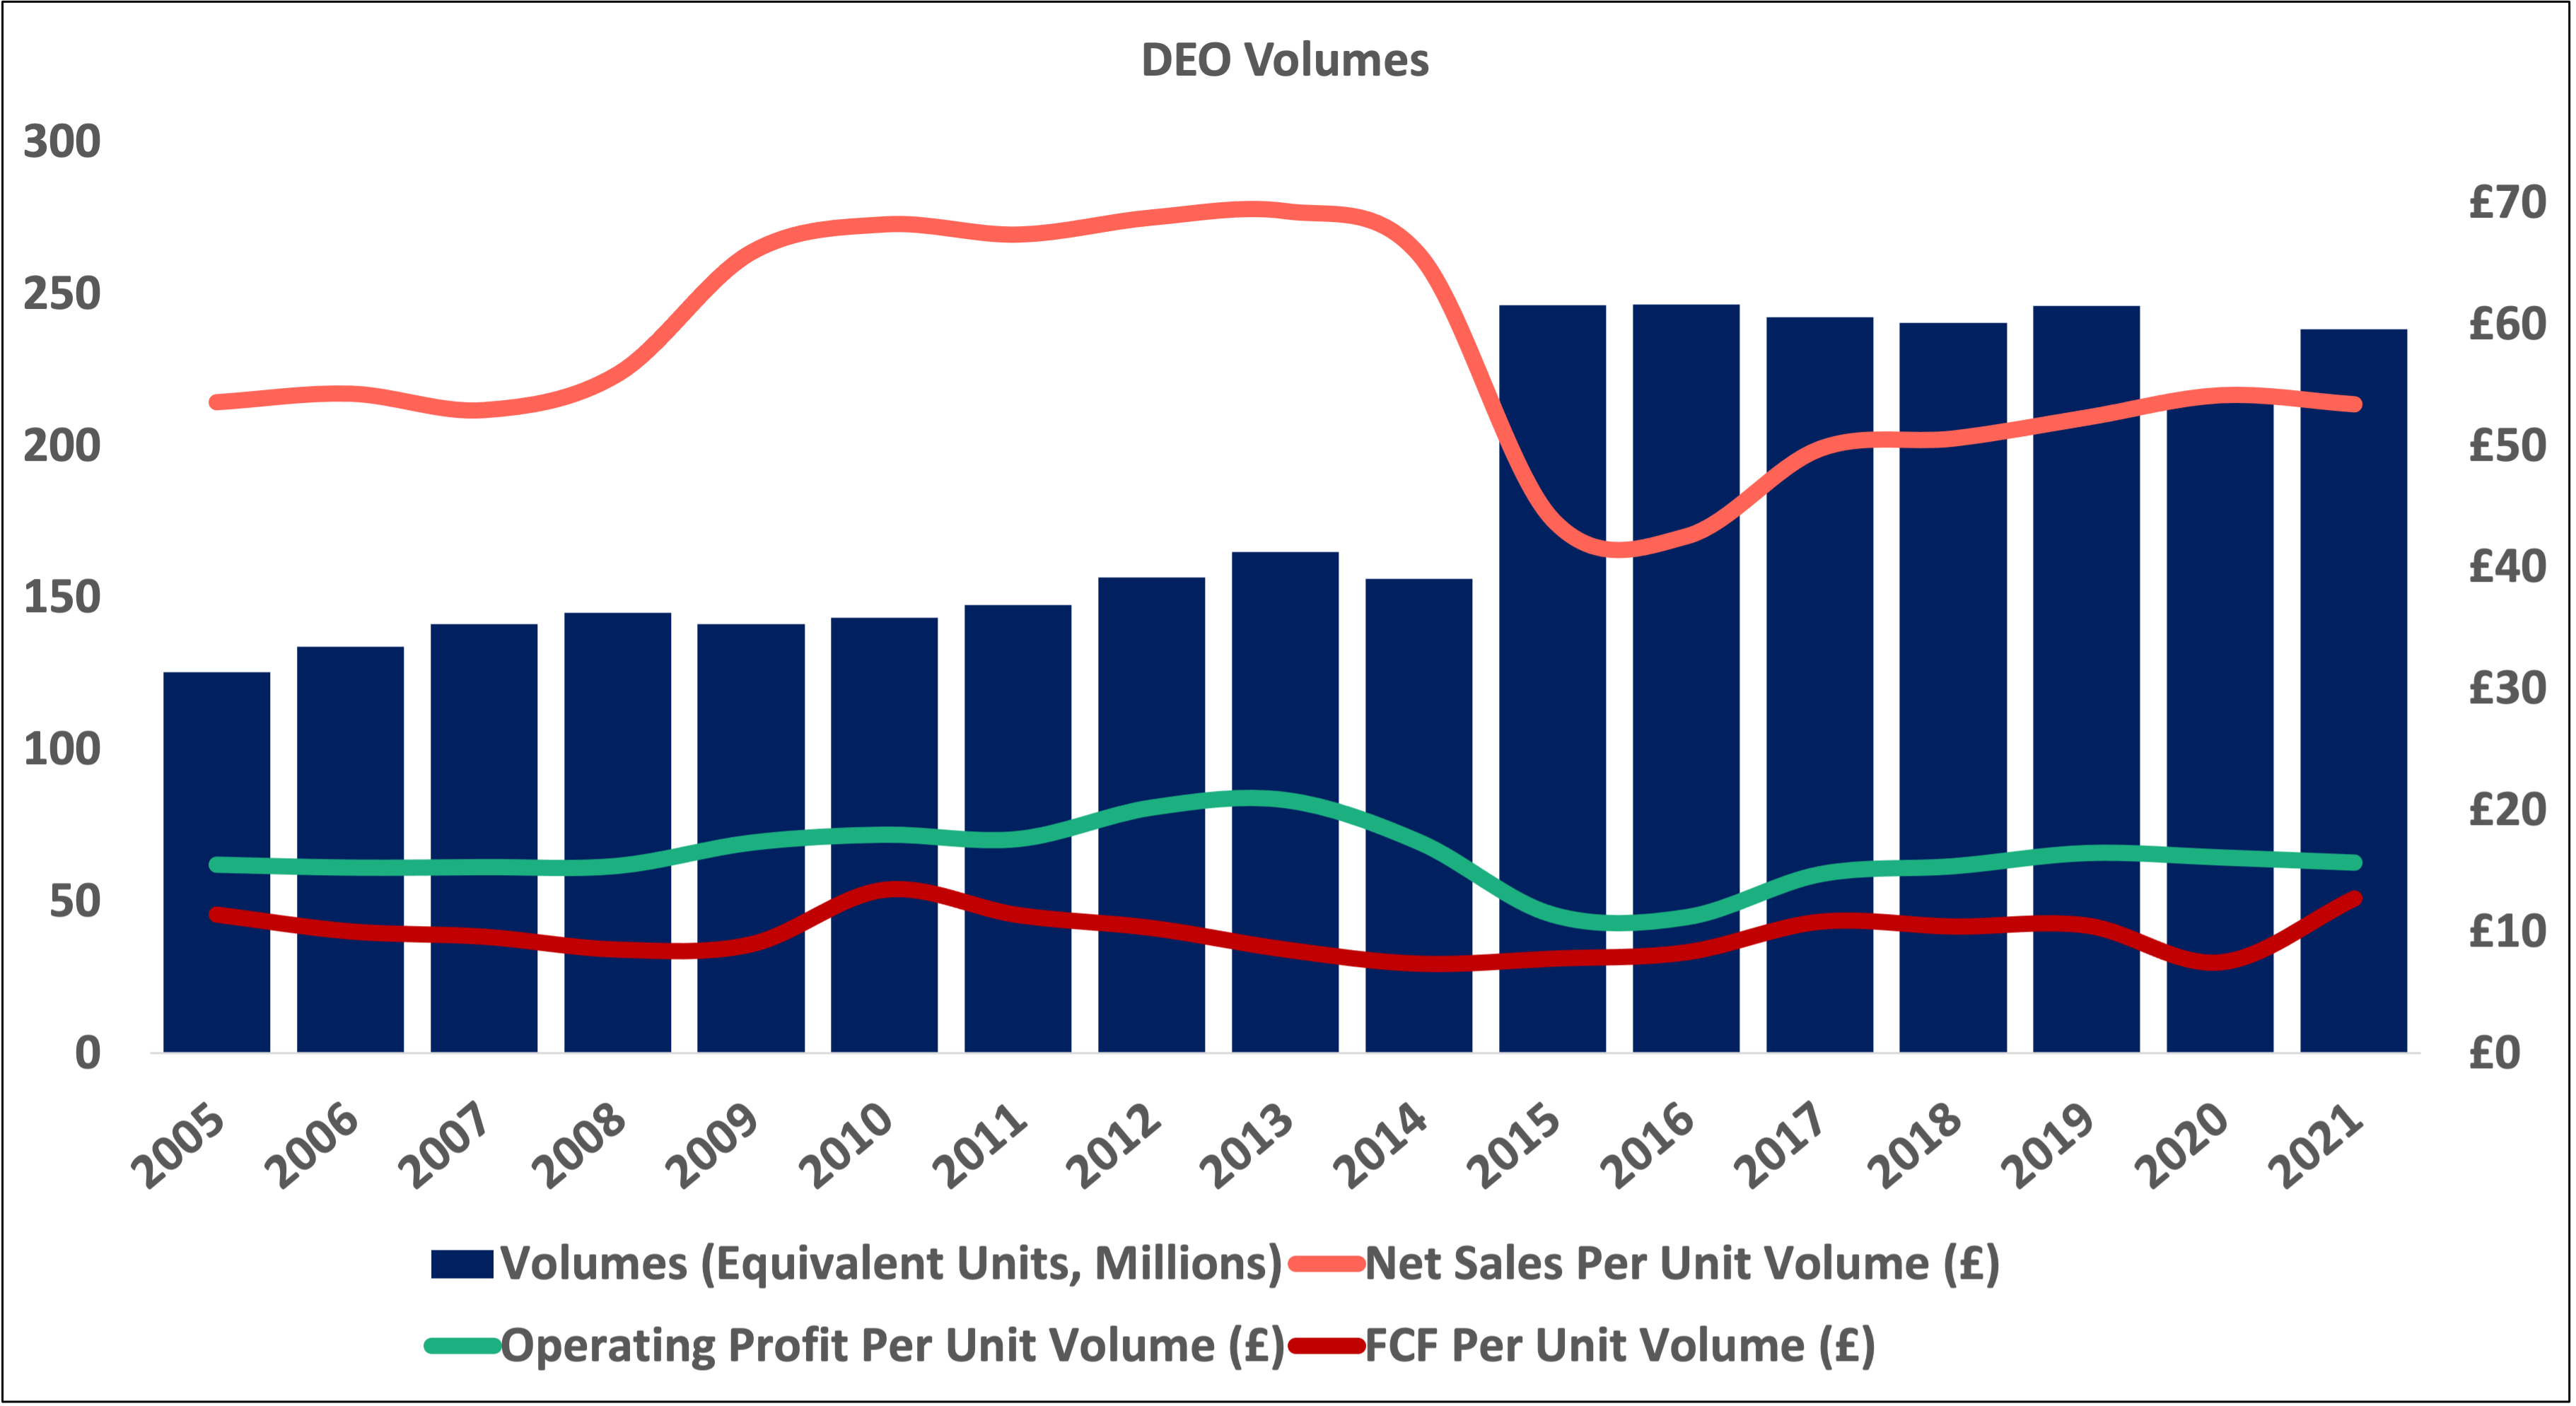
Volumes. Acquisition activity during the 2014-2015 period led to a big jump in volumes. Net sales and operating profit per unit volume dropped, however, likely due to an increase in the proportion of total volumes sold in countries with weaker currencies relative to the pound. The acquisition of a controlling stake in United Spirits Limited in India during the 2014-2015 period was likely the culprit.
Personal notes. Management’s focus on premium brands and its willingness to push more chips into long-term growth opportunities like higher tier brands in growing markets and ready-to-drink products are approaches that will likely benefit shareholders over the long term.
Despite management’s emphasis on higher tier brands, the company has held onto non-premium, global cash cows like Captain Morgan and Smirnoff and value brands like Gordon’s Gin. There is no one brand or spirits category that totally dominates the company’s top and bottom lines — though, whiskey comes close. The company is certainly not dependent on one or two specific brands to drive growth. With the company’s 200+ brands spread out across many spirits categories throughout the world (plus its beer portfolio), it is almost as if the company is a sort of global index of premium and popular alcohol brands.
It would be nice if management and the board would consider adopting a more aggressive share buy-back policy. Opportunistically ramping up buy-backs when downturns in the markets cause the share price to fall would be better than the somewhat stagnant share count that has been the norm for the company over the past decade. On the other hand, management has not been dilutive either, so investors cannot complain too much.
Brown-Forman (BF.B)
Background. Brown-Forman was founded in Kentucky in 1870 by pharmaceuticals salesman George Brown. The company later survived Prohibition by serving as one of four government-approved distilleries permitted to sell alcohol for medicinal purposes. Today, the company is controlled by Brown’s descendants — a group of about 40 cousins. These cousins control most of the company’s Class A shares which are voting shares (BF.A). Ticker BF.B represents the company’s non-voting Class B shares. Over 90% of sales come from the company’s spirits businesses with the remainder coming from its wine, non-branded/bulk, travel retail, and “rest of portfolio” segments. The company is headquartered where it was founded: Louisville, Kentucky.
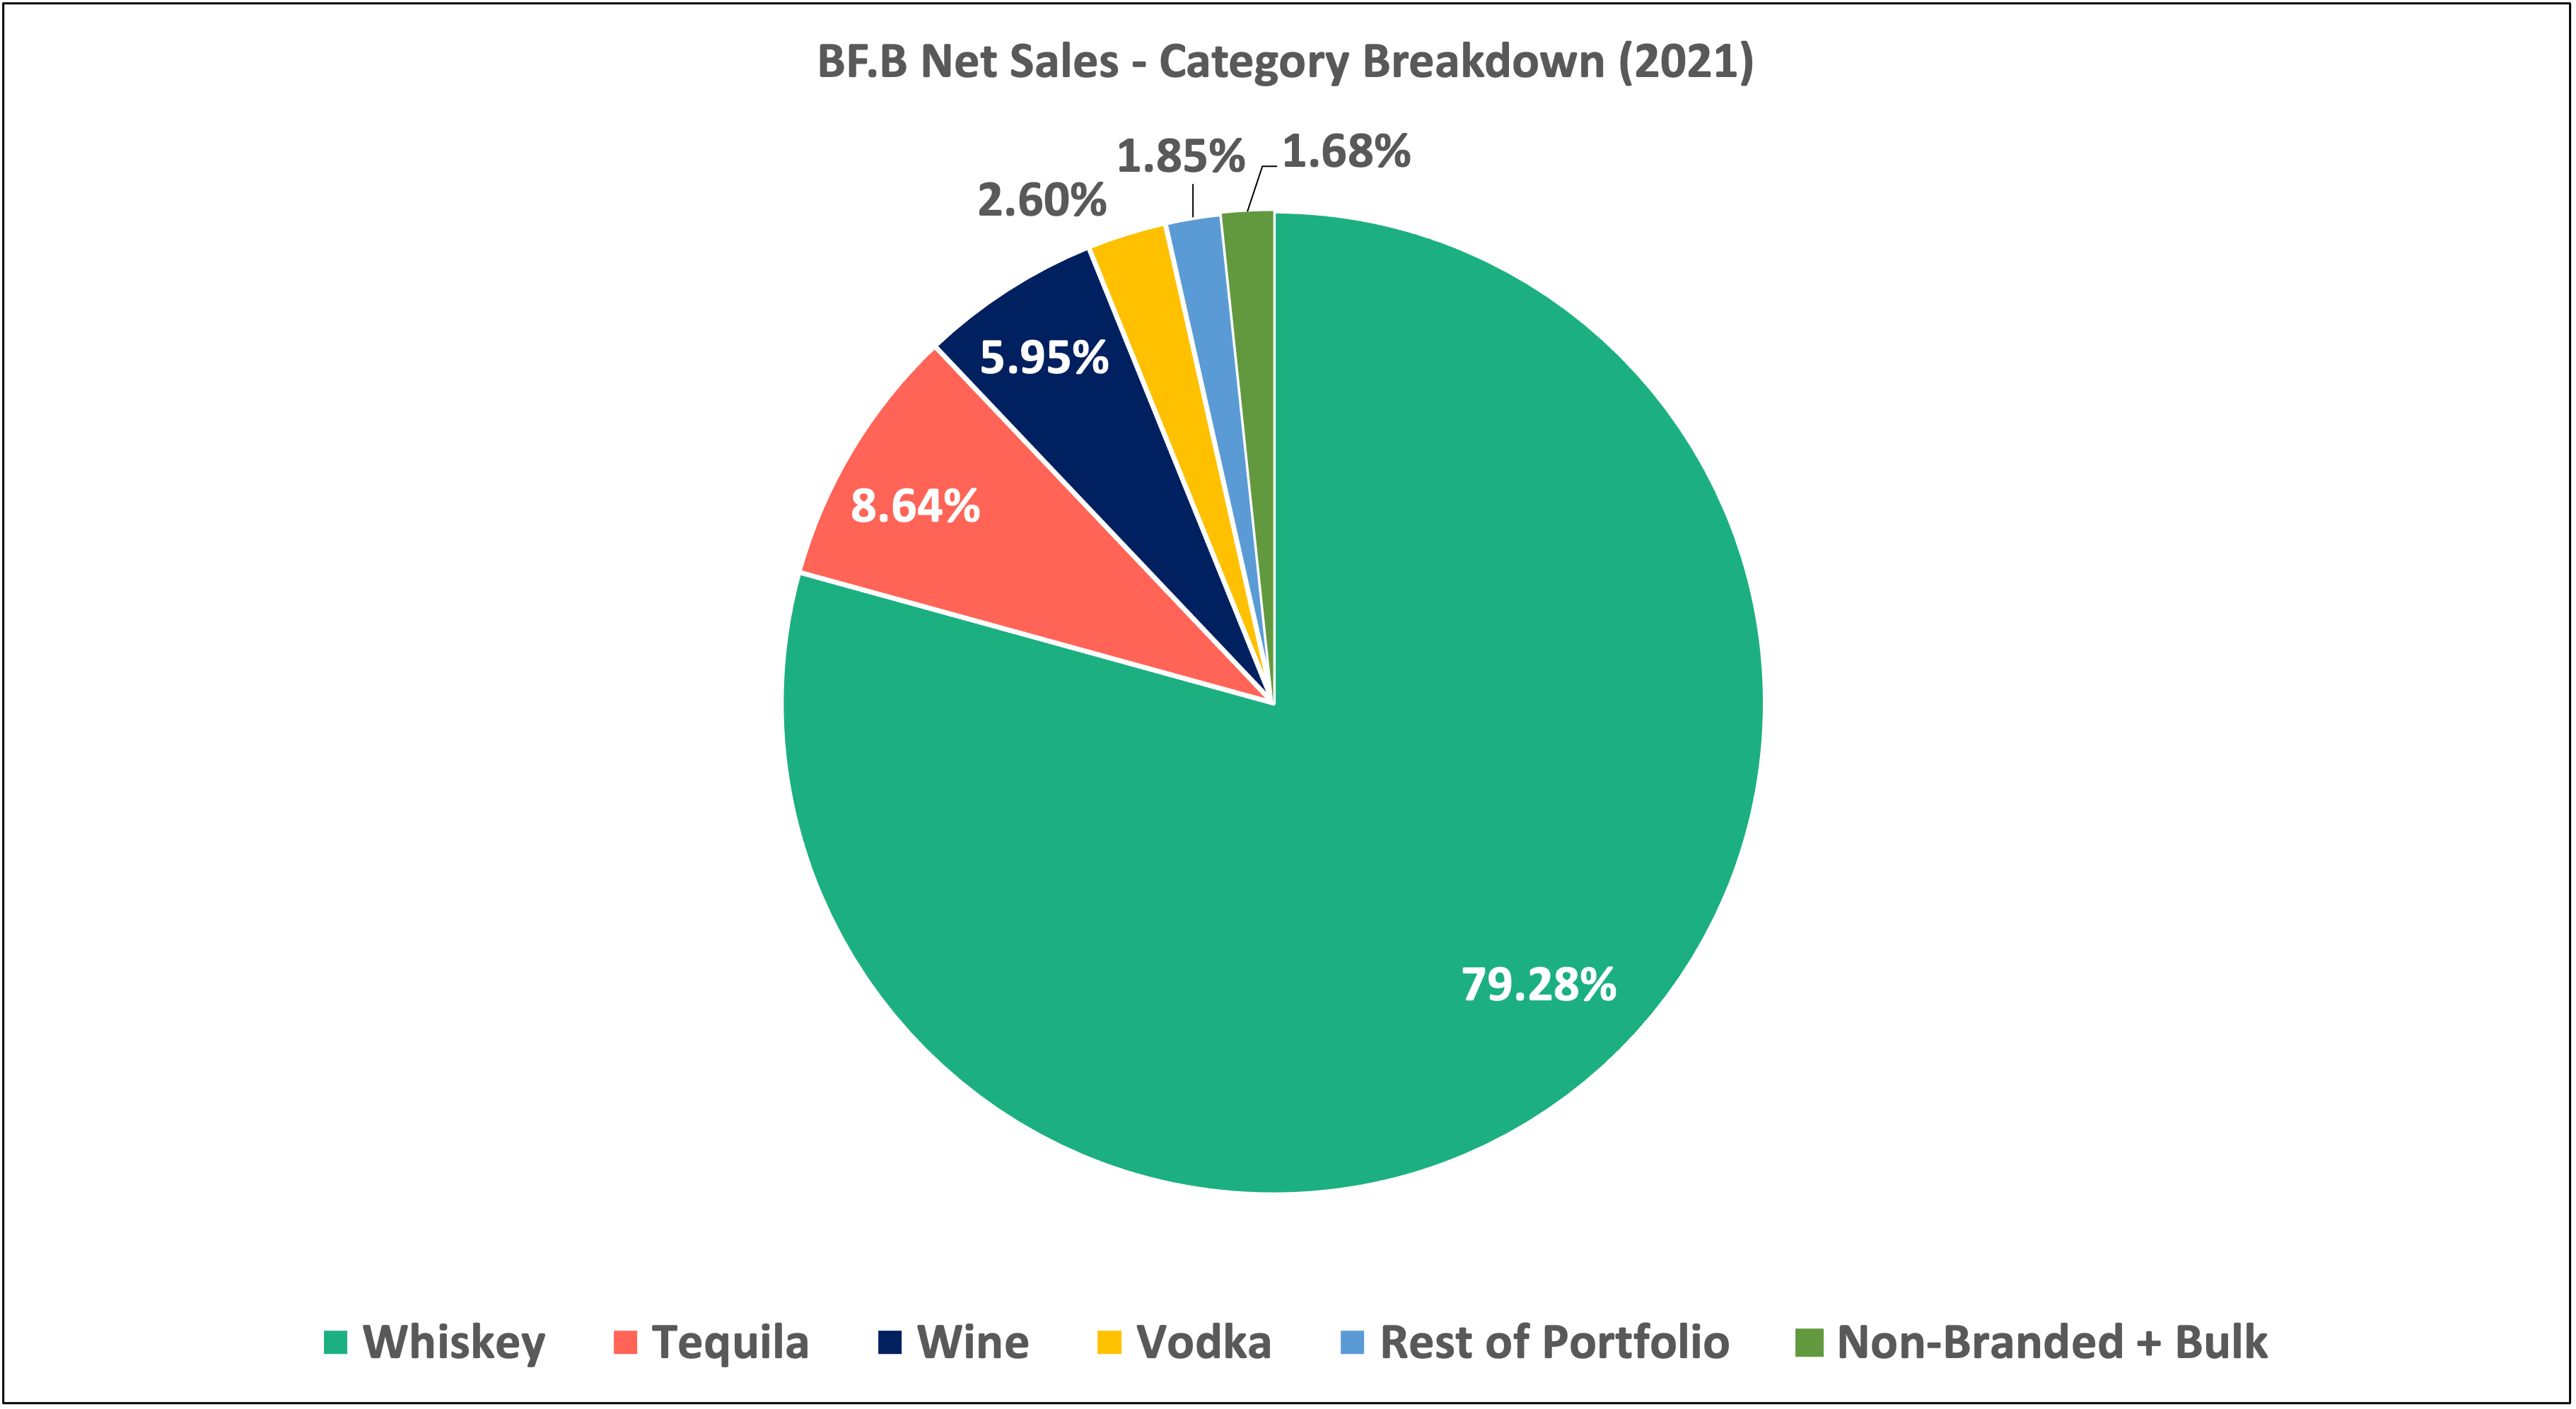
Brands. Brown-Forman’s is largely a whiskey company. The company’s flagship brands are Jack Daniel’s Tennessee Whiskey (JDTW) and Woodford Reserve. The company’s whiskey portfolio is responsible for almost 80% of net sales. Its tequila portfolio consisting of five tequila brands is responsible for just under 11% of net sales. Its two wine brands bring in over 7% of net sales, and its vodka business (Finlandia) accounts for just over 3% of net sales (down from nearly 5% in 2019). Since 2019, vodka net sales are down while whiskey, tequila, and wine are up. In total, the company holds around forty brands, many of which are sub-brands (for example, there are twelve separate brands under the Jack Daniel’s umbrella and five in the Woodford Reserve family). Excluding these sub-brands, the company has closer to twelve primary brands.
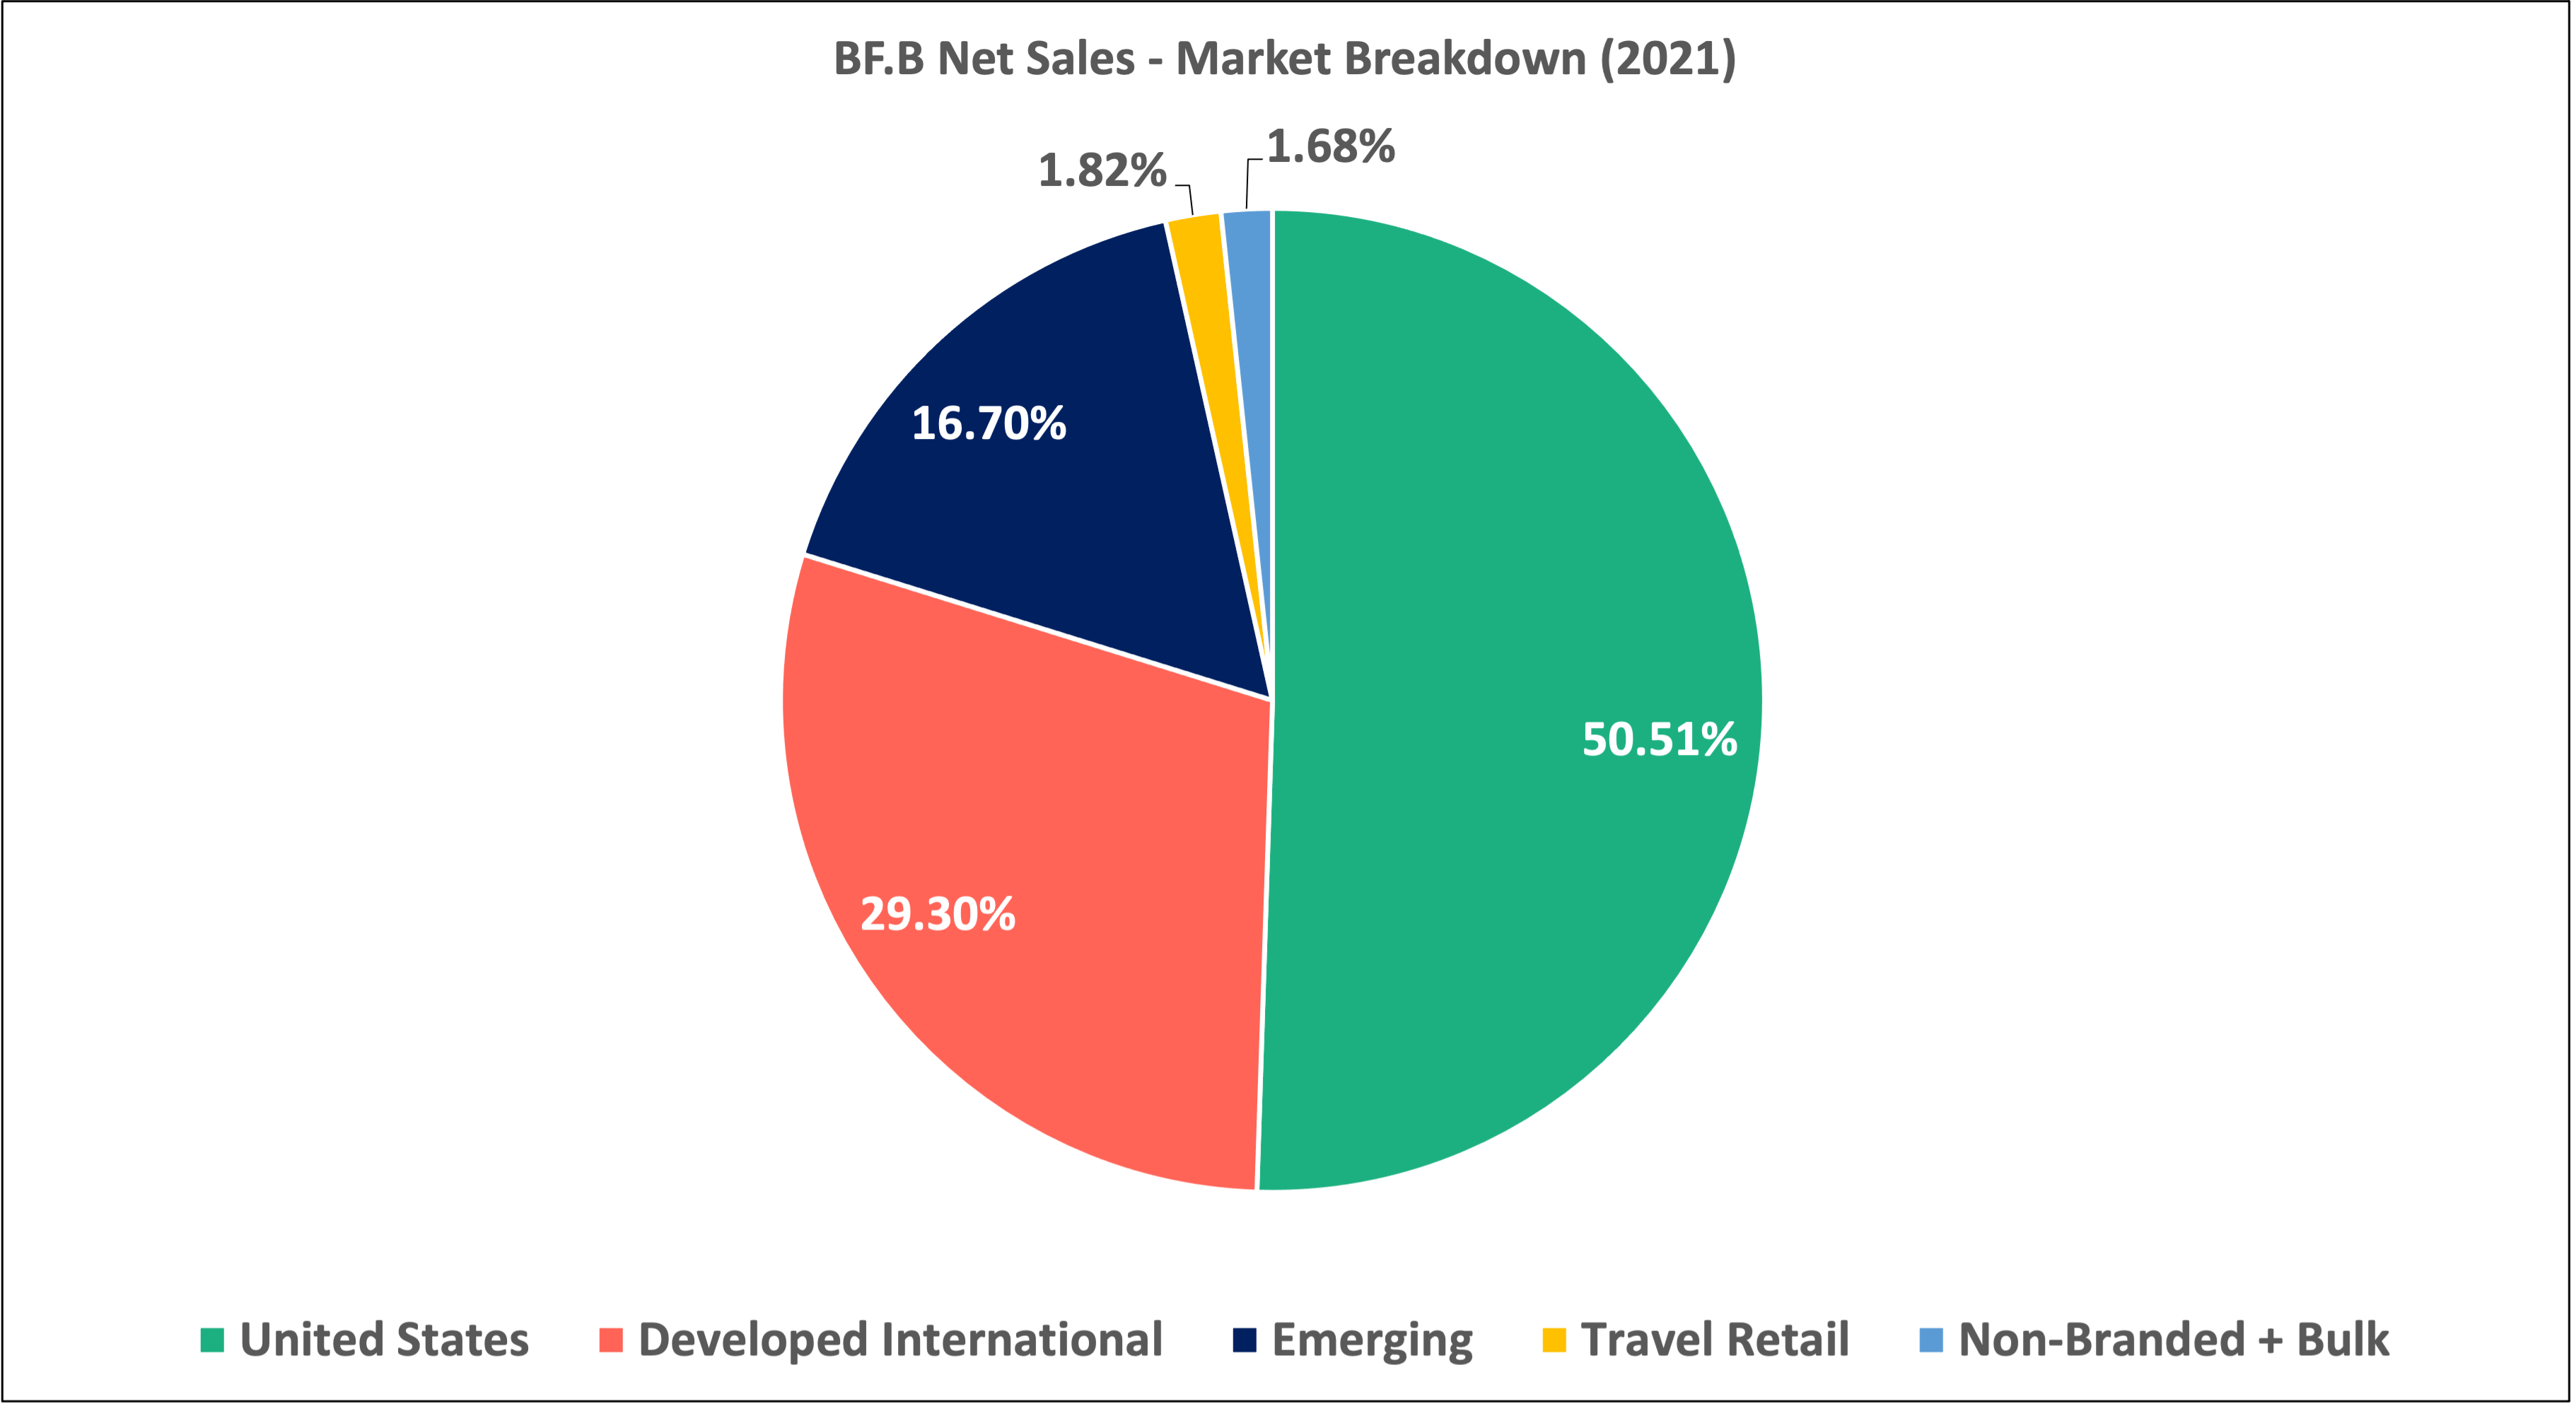
Markets. Brown-Forman breaks down its markets into three groups: (1) the United States; (2) developed international (Australia, Germany, the U.K., France, etc.); and (3) emerging (Mexico, Poland, Brazil, Russia, etc.). The U.S. accounts for half of all net sales. Developed international accounts for 29%. Emerging accounts for 17%. And the remaining share of net sales come from travel retail and bulk/non-branded net sales.
China does not appear to be a big focus for the company. The country is not listed in the company’s net-sales-by-geography breakdown and it is mentioned only six times in the company’s 2021 annual report/10-K.
Strategy. Brown-Forman’s management team has been focused on developing and managing its portfolio of premium alcohol brands — and it has long recognized the effects of “premiumization” on the alcohol industry. From the company’s 2021 annual report:
Even as COVID-19-related restrictions ease, we expect the premiumization trend that we have been observing for over two decades to continue, which we believe will support the strong growth of our super-premium brands in the years ahead.
Management is also focused on extending its existing brands to the ready-to-drink space. These efforts are proving to be very successful given growing demand for convenient mixed drinks at home. Jack Daniels, Jimador, and its newly acquired Part Time Rangers brand have all been instrumental in the company’s push into RTD product lines. The company is now selling tens of millions of RTD units — and it seems sales are growing at a fast pace (though, the company does not disclose ready-to-drink net sales totals).
Acquisitions & divestitures. Brown-Forman has over the decades sold off non-core businesses (like Lenox in 2005 and Hartman Luggage in 2007) and lower tier alcohol brands (like Southern Comfort and Tuaca to Sazerac in 2016) while acquiring high end liqueur (Chambord in 2006), tequila (Herradura in 2007), and whiskey (BenRiach in 2016) businesses. The company also acquired New Zealand-based ready-to-drink brand Part Time Ranger in 2020.
The company has pared down its wine business significantly over the years. In 2008, it sold off its long-held wine business Bolla as well as its Fontana Candida wine brand. And in 2011, it sold its Fetzer Vineyards family of wineries to a wine conglomerate. Most recently in 2020-2021, the company sold a few brands to Sazerac, a company that appears to eat whatever alcohol brands its competitors don’t want. These sales have helped Brown-Forman re-center its business around high-end whiskey supplemented by slices of exposure to high-growth categories like tequila and RTD.
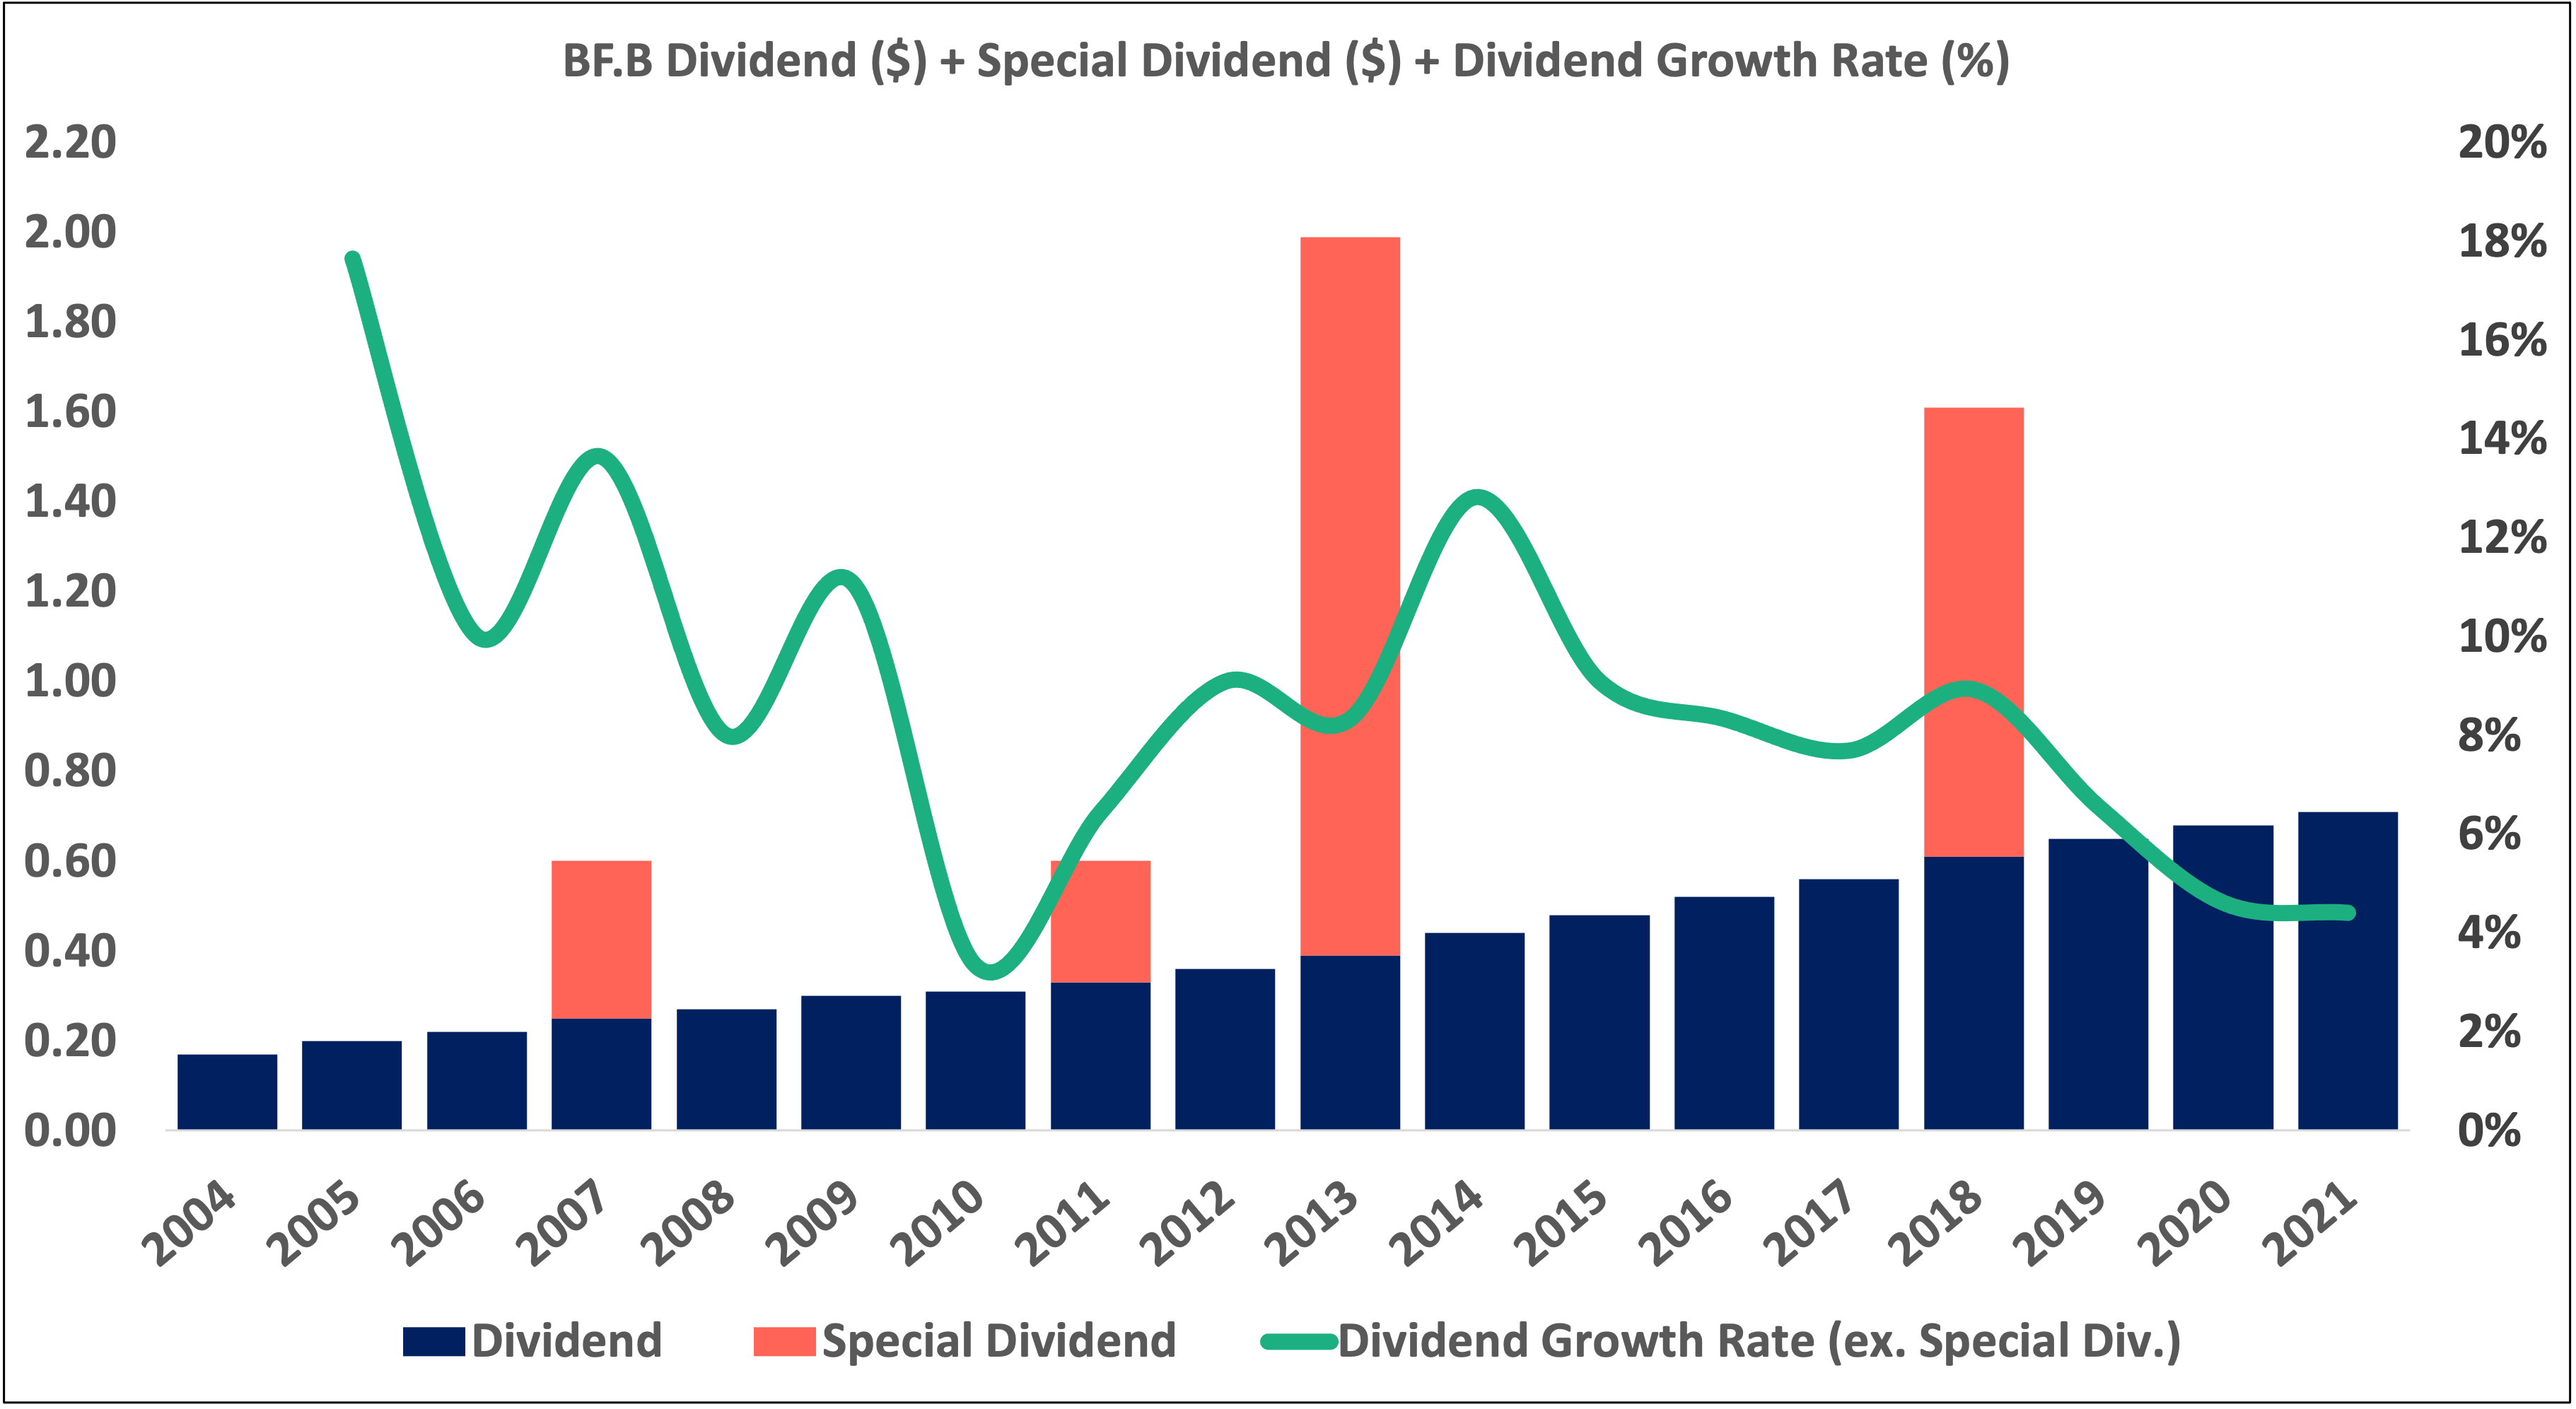
Capital allocation. Brown-Forman has paid a dividend since the 1940s and has raised its dividend each year since the 1980s. The company does issue substantial special dividends from time to time. Since 2004, the dividend’s average annual growth rate (excluding special dividends) has been 8.83%.
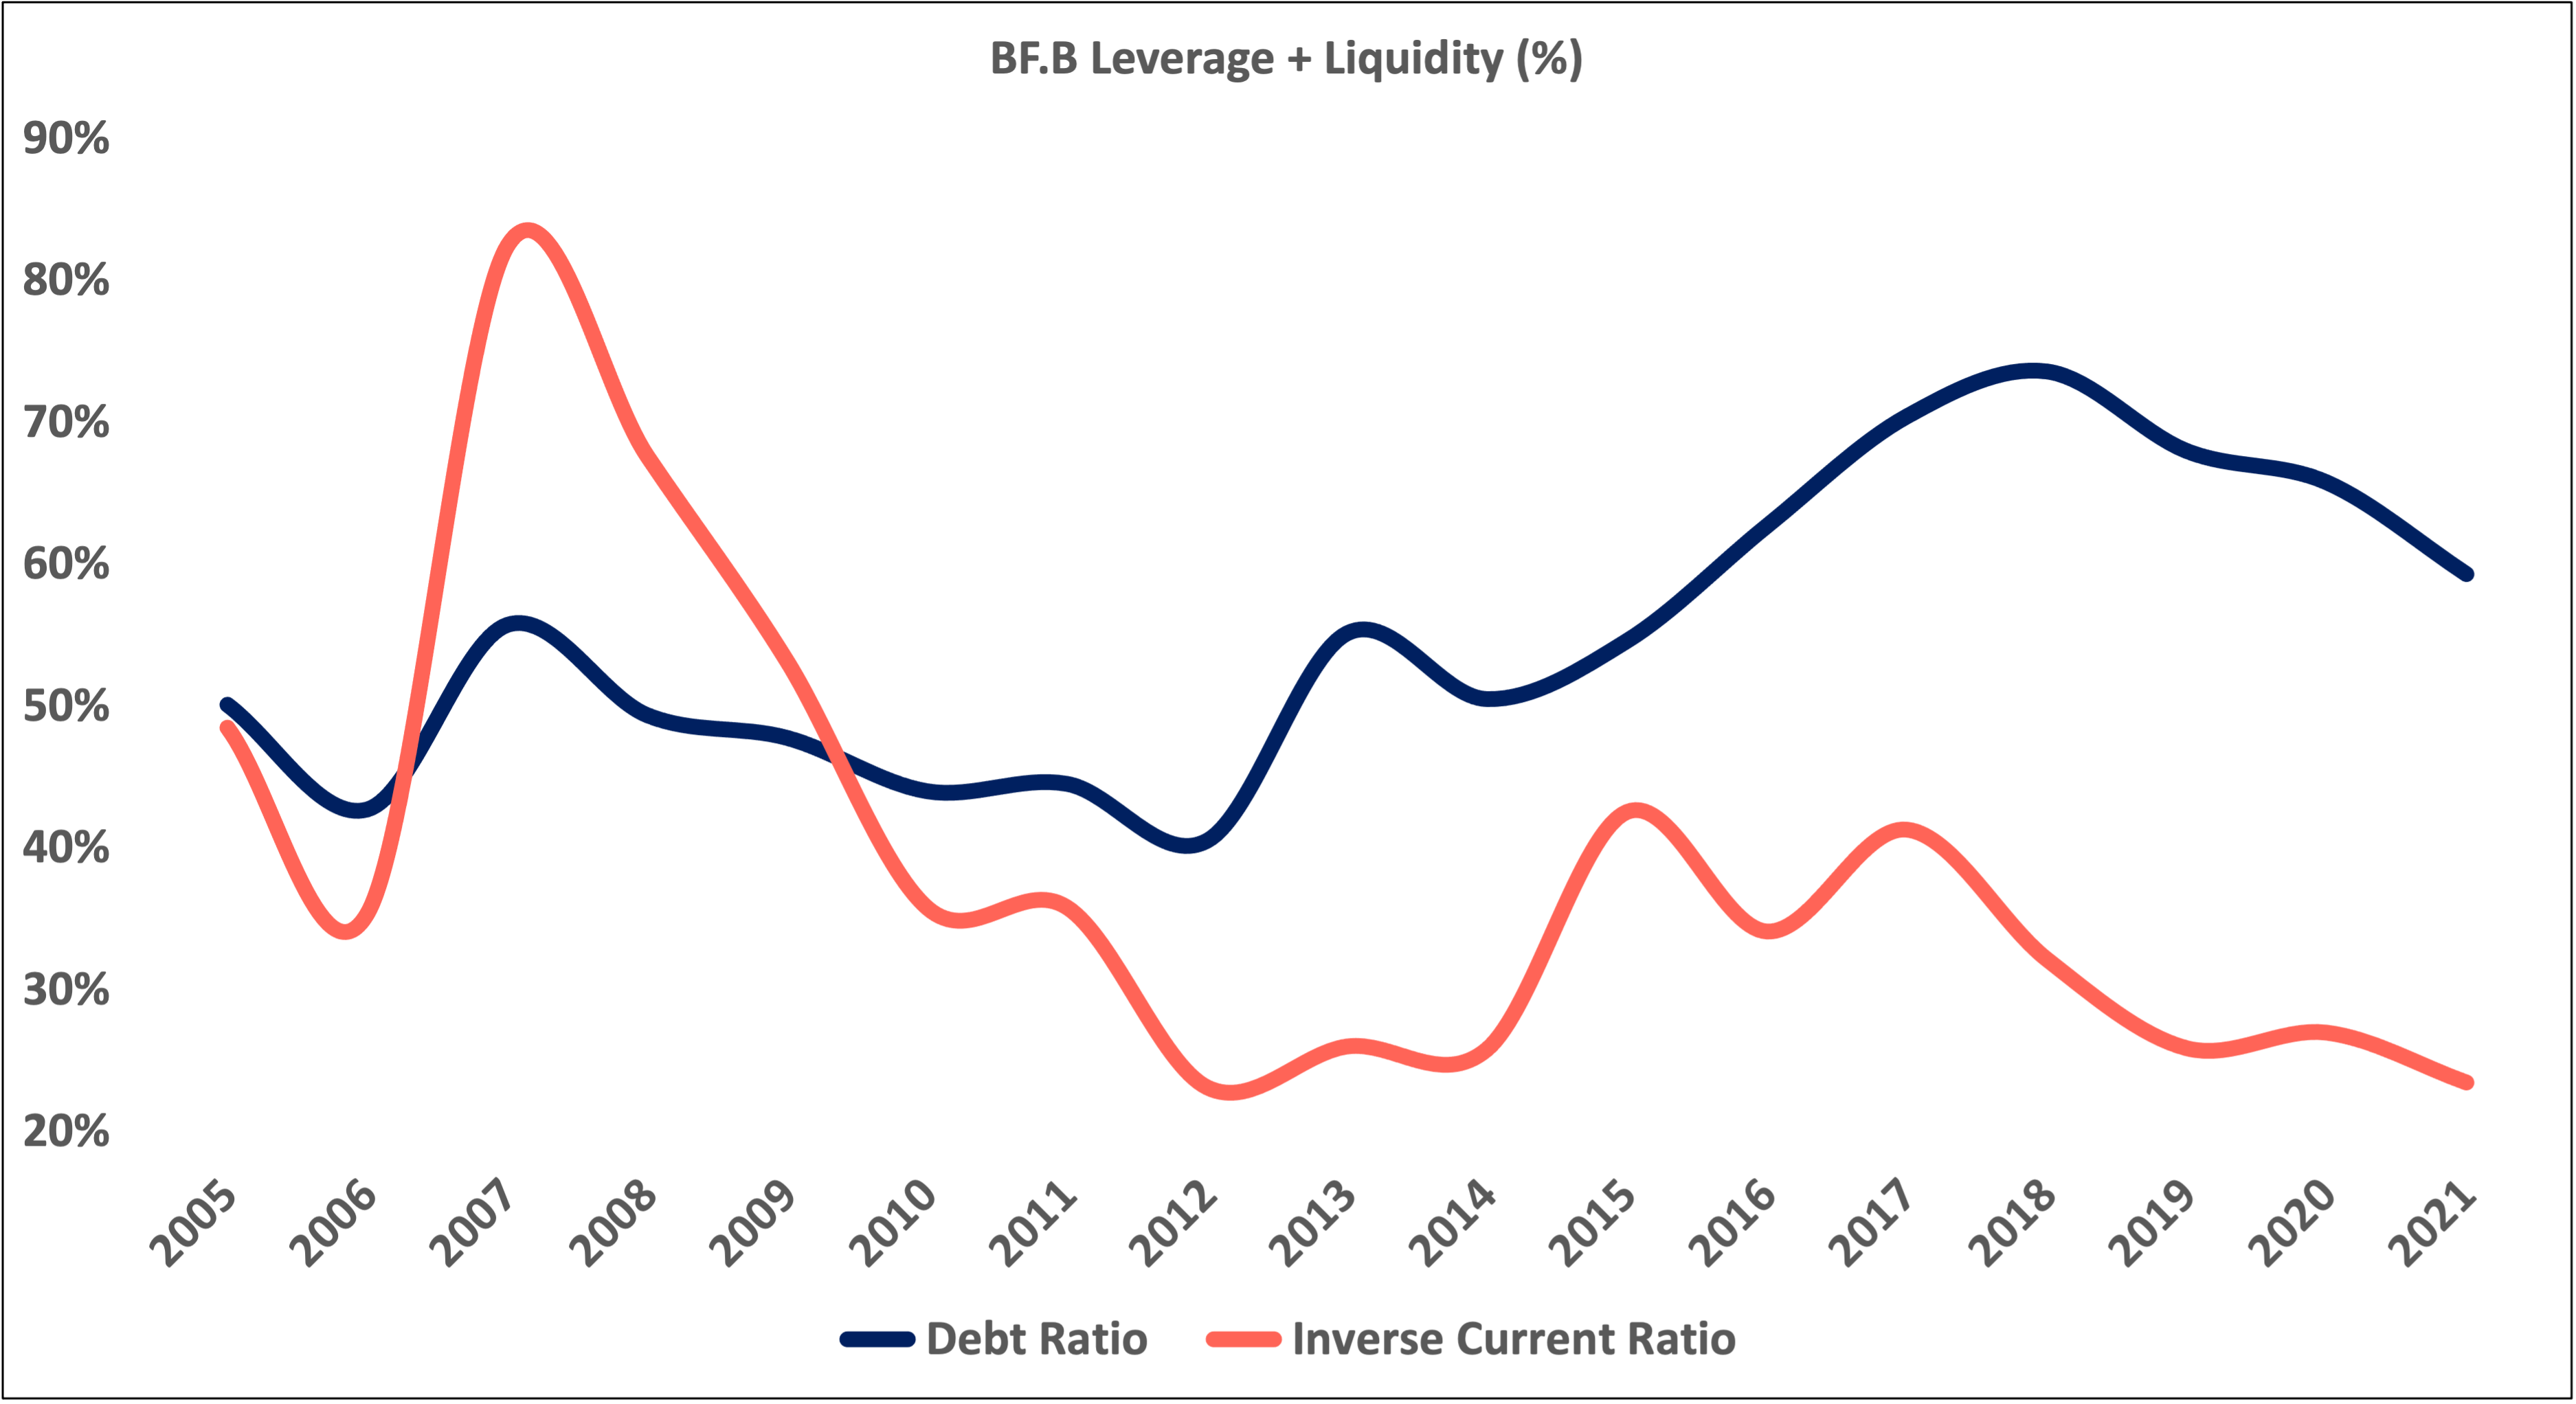
Leverage + liquidity. Since 2010, management has been able to keep current liabilities as a percent of current assets low relative to the company’s debt ratio (total debt / total assets).
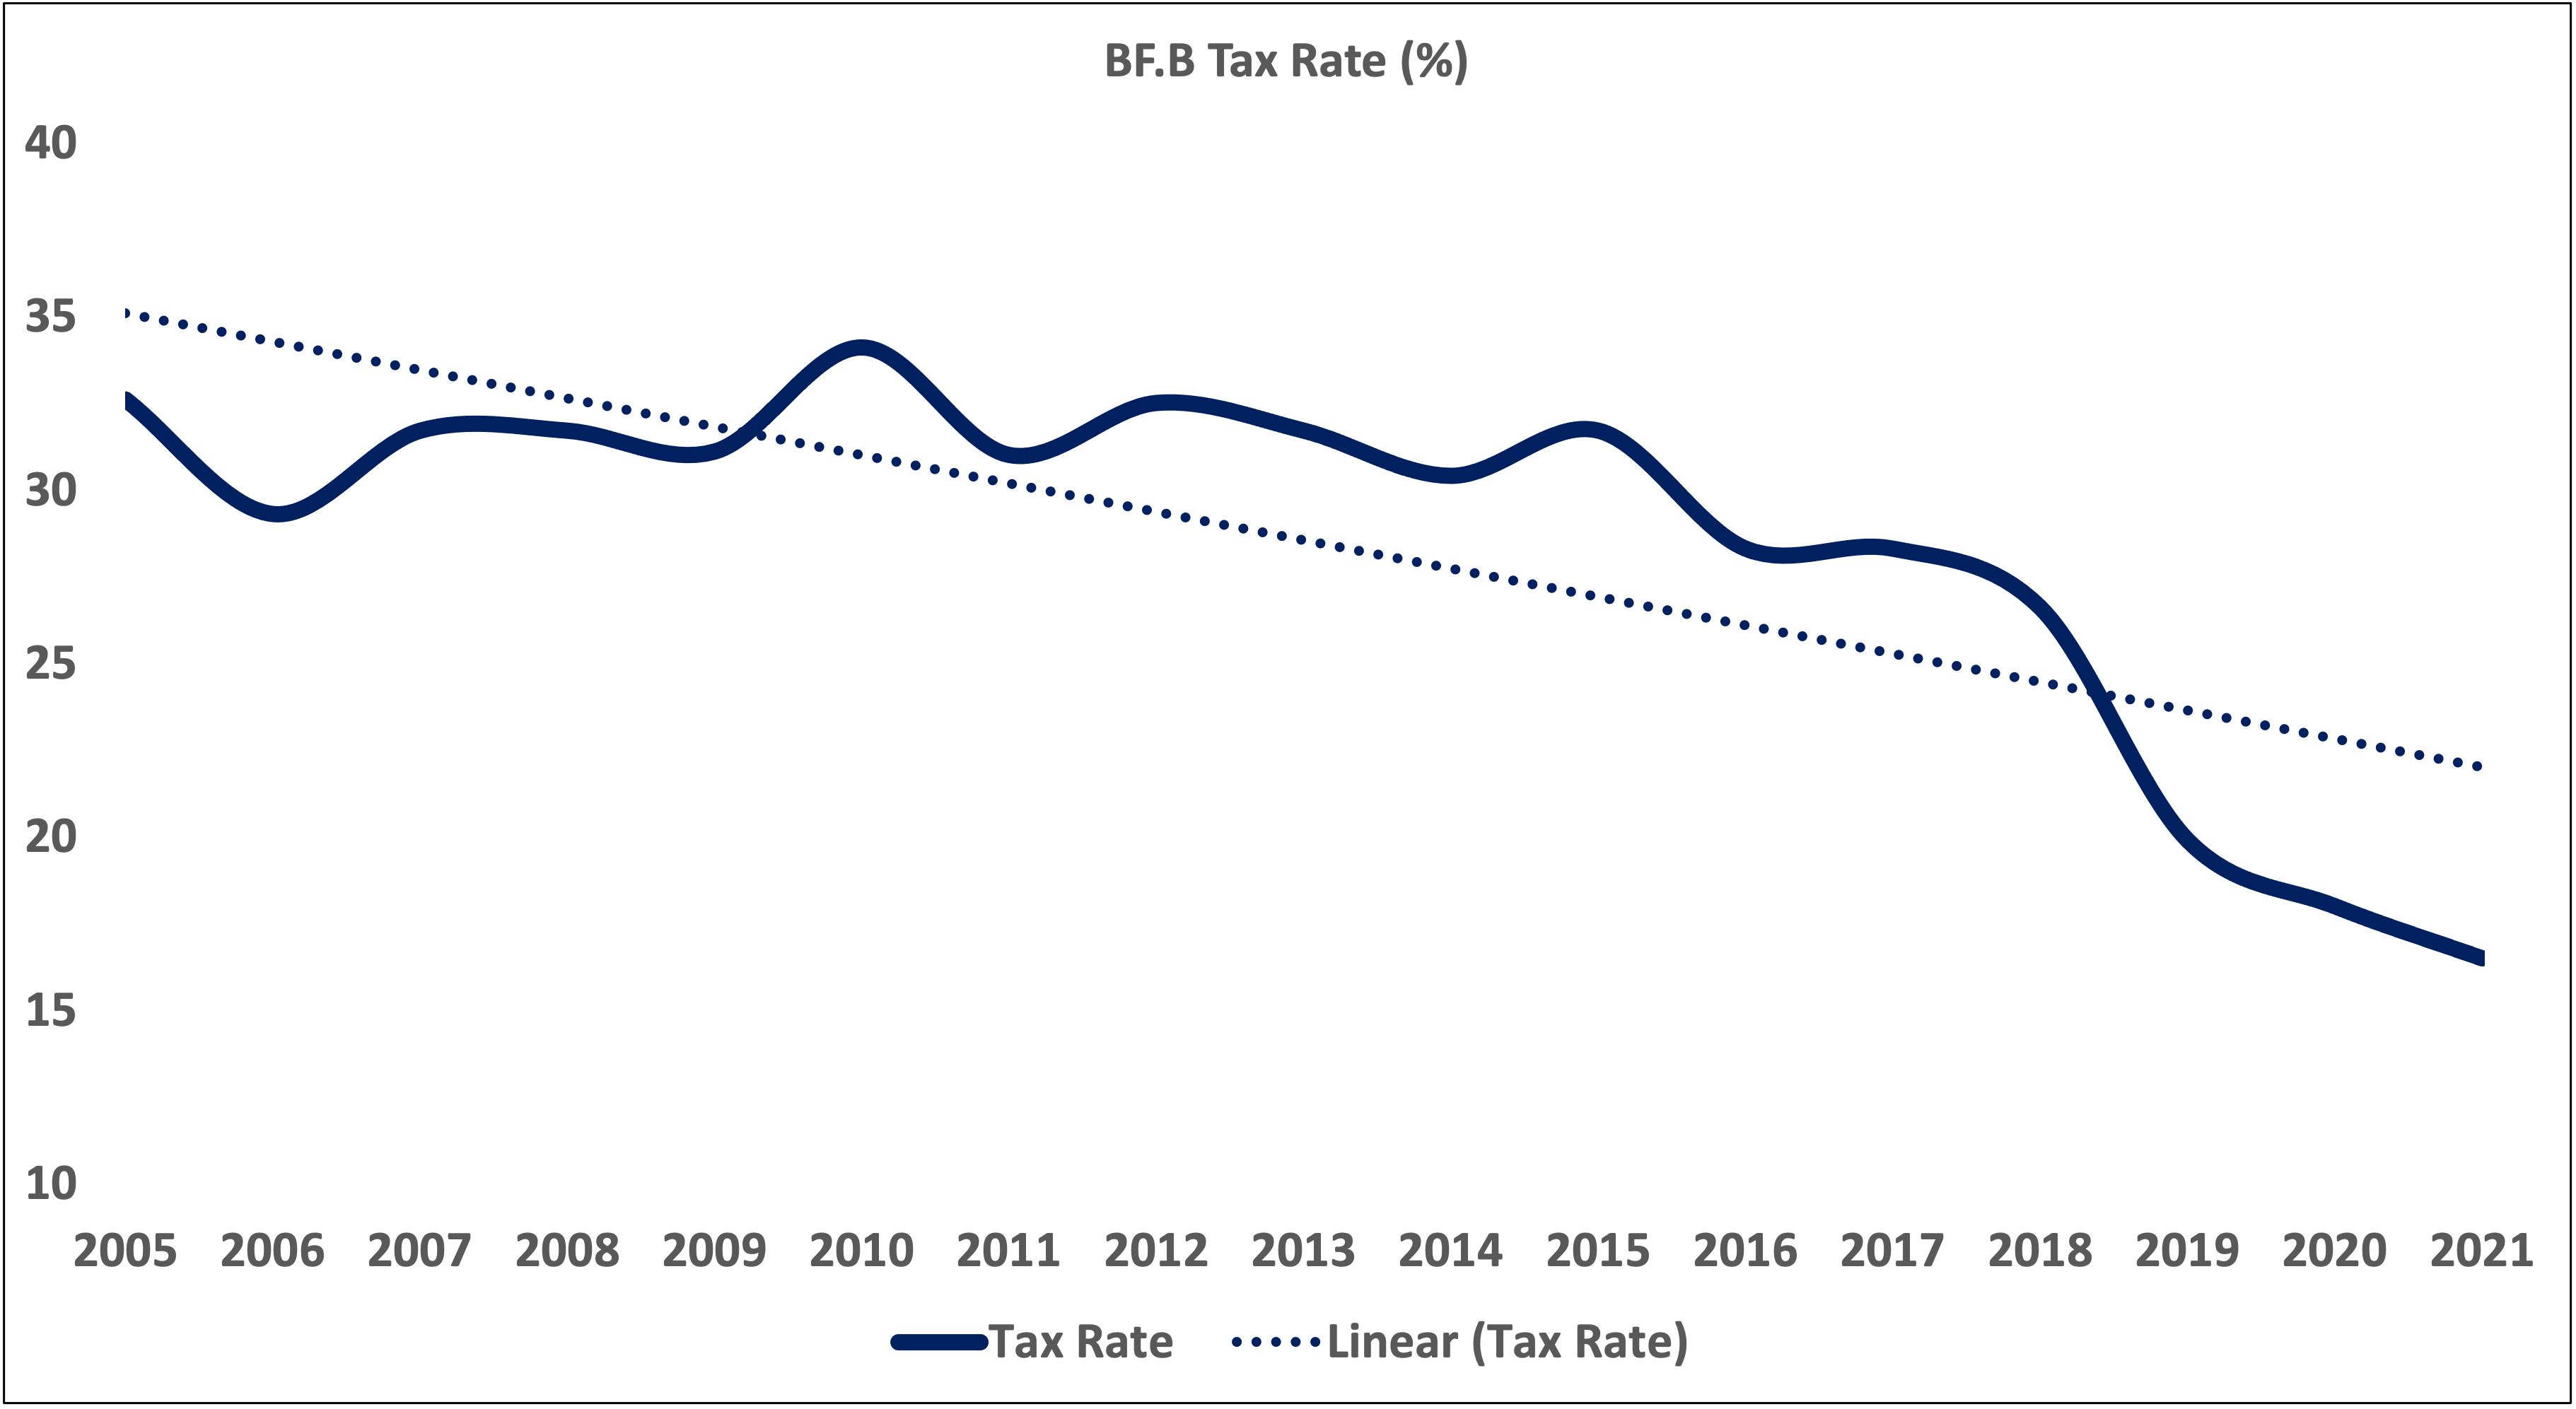
Taxes. The company’s effective tax rate has been on the decline since 2010 and is trending below 20%. The company expects its tax rate to be around 20% going forward — this is a big improvement likely thanks to decreases in the U.S.’s corporate tax rate in recent years.
Volumes. Management does not break out total volumes, so it is difficult to figure out how much cash the company brings in on a per-unit basis. Management does break out volumes for major brands like Jack Daniels.
Personal notes. American whiskey is in Brown-Forman’s DNA. While it does own strong, high-end tequila, vodka, and liqueur brands, the company’s heart and soul is in its whiskey business — namely, Jack Daniel’s. Management has gone all out with its iconic Jack Daniel’s brand — it has extended the brand to Jack Daniel’s ready-to-drink products, Gentlemen Jack, Jack Daniel’s Tennessee Apple, and many other sub-brands. JDTW is so core to the company that it is listed as the number one risk factor in the company’s 10k:
Our business performance is substantially dependent upon the continued health of the Jack Daniel's family of brands. The Jack Daniel's family of brands is the primary driver of our revenue and growth.
Brown-Forman is also very much so an America-first company. Management has noted that “[t]he United States remains [the company’s] largest market, and continued growth there is important to our long-term success.” That said, management is not sleeping on international markets. The company has announced that it will soon own its distribution organizations in the U.K., Thailand, Belgium, Russia, and Taiwan. Management expects “increasing contributions to [the company’s] long-term future growth from emerging markets, including Brazil, China, India, Mexico, Poland, Russia, and Southeast Asia.”
Head-to-Head
Size. Diageo is more than triple the size of Brown-Forman, bringing in four times the net sales, more than three times the operating profits, and four times the free cash flow.
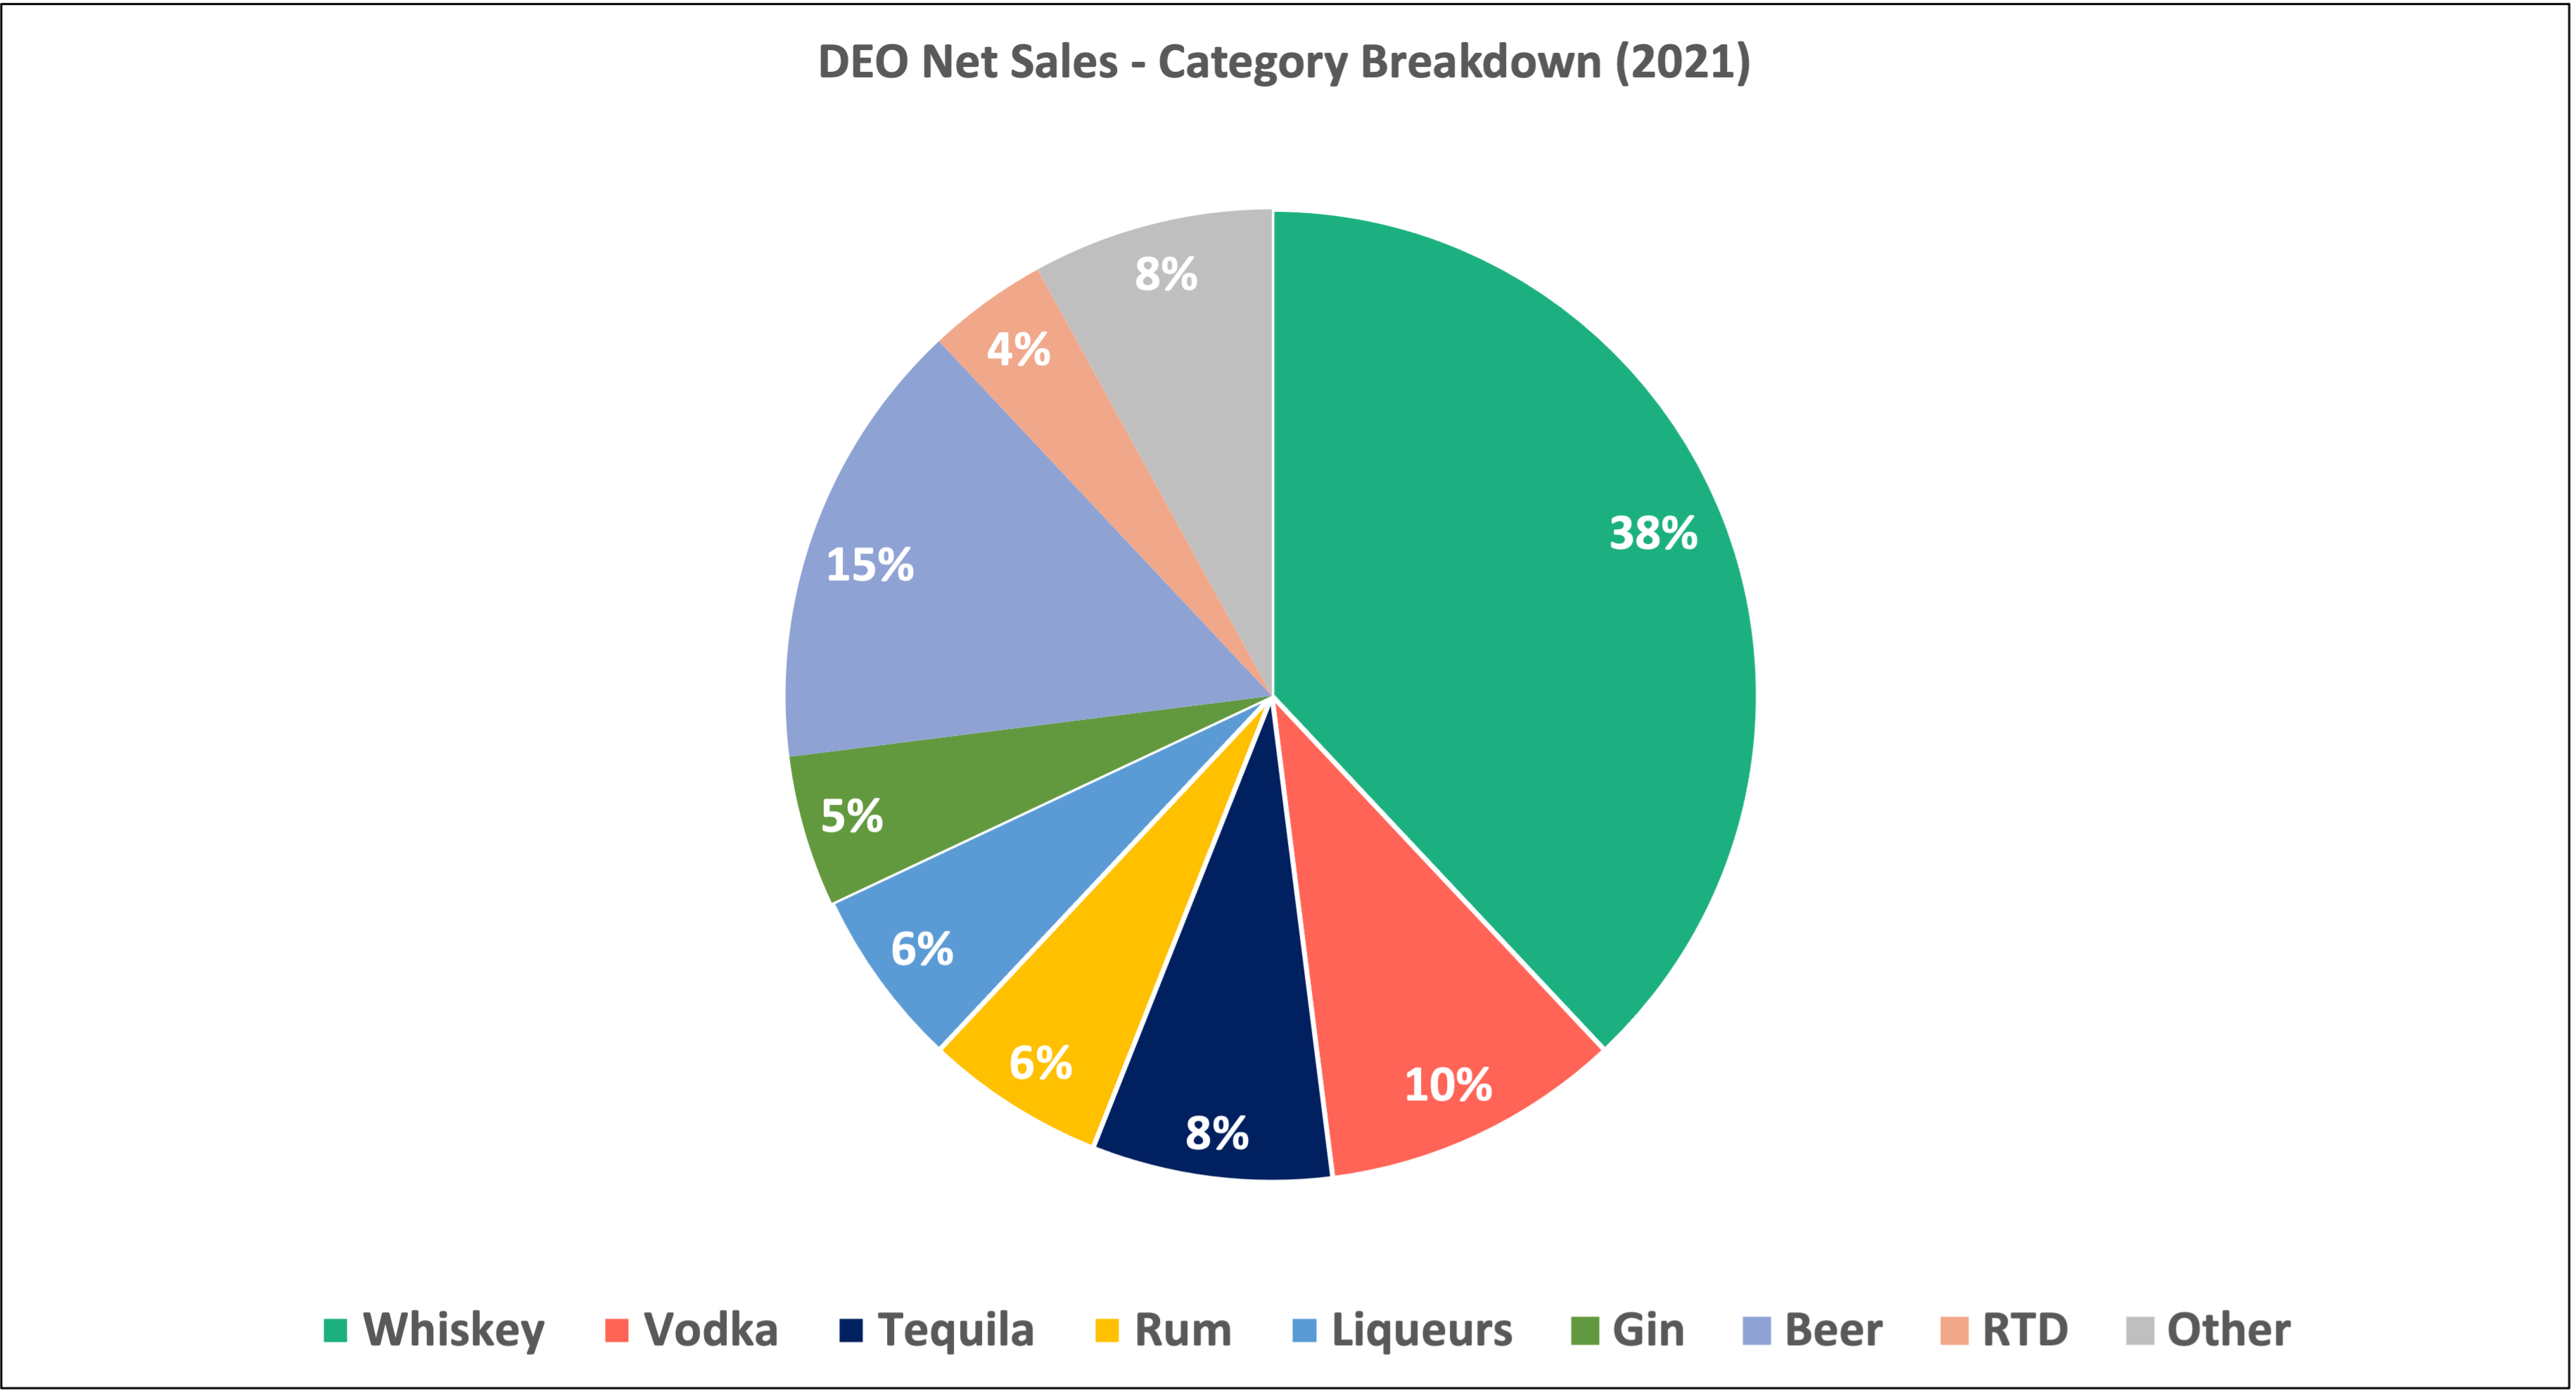
Category concentration. Brown-Forman is much more concentrated in one spirits category with whiskey pulling in ~80% of sales, whereas Diageo’s largest category (also whiskey) brings in 38% of sales.
Brand diversity. Diageo holds over five times the number of brands that Brown-Forman holds (200+ v. ~40).
International reach. Diageo functions very much as a world index of premium and popular alcohol brands. North America (its largest market) brings in 41% of its sales, while Europe and Turkey, Asia Pacific, Africa, and LatAm and Caribbean bring in 20%, 20%, 11%, and 8%, respectively.
Brown-Forman relies more on developed markets than does Diageo. The U.S. alone is responsible for 50% of Brown-Forman’s sales. Developed international markets are responsible for another 30%. Emerging markets bring in ~16%.
Balance sheets. Brown-Forman is the more conservative of the two when it comes to managing the balance sheet. Since 2005, on average, Brown-Forman has kept its debt and current ratios below 55% and 40%, respectively, while Diageo has kept both just under 70%. While both companies are certainly seasoned buyers and sellers of alcohol brands, Diageo appears to be more of an “empire-builder” than Brown-Forman. Diageo’s higher levels of leverage relative to Brown-Forman indicate the former’s readiness to borrow to grow via acquisitions. Brown-Forman, on the other hand, appears to rely to a greater degree on growing the business internally (e.g. its brand extension efforts with Jack Daniel’s) — and its lower levels of leverage reflect that approach.
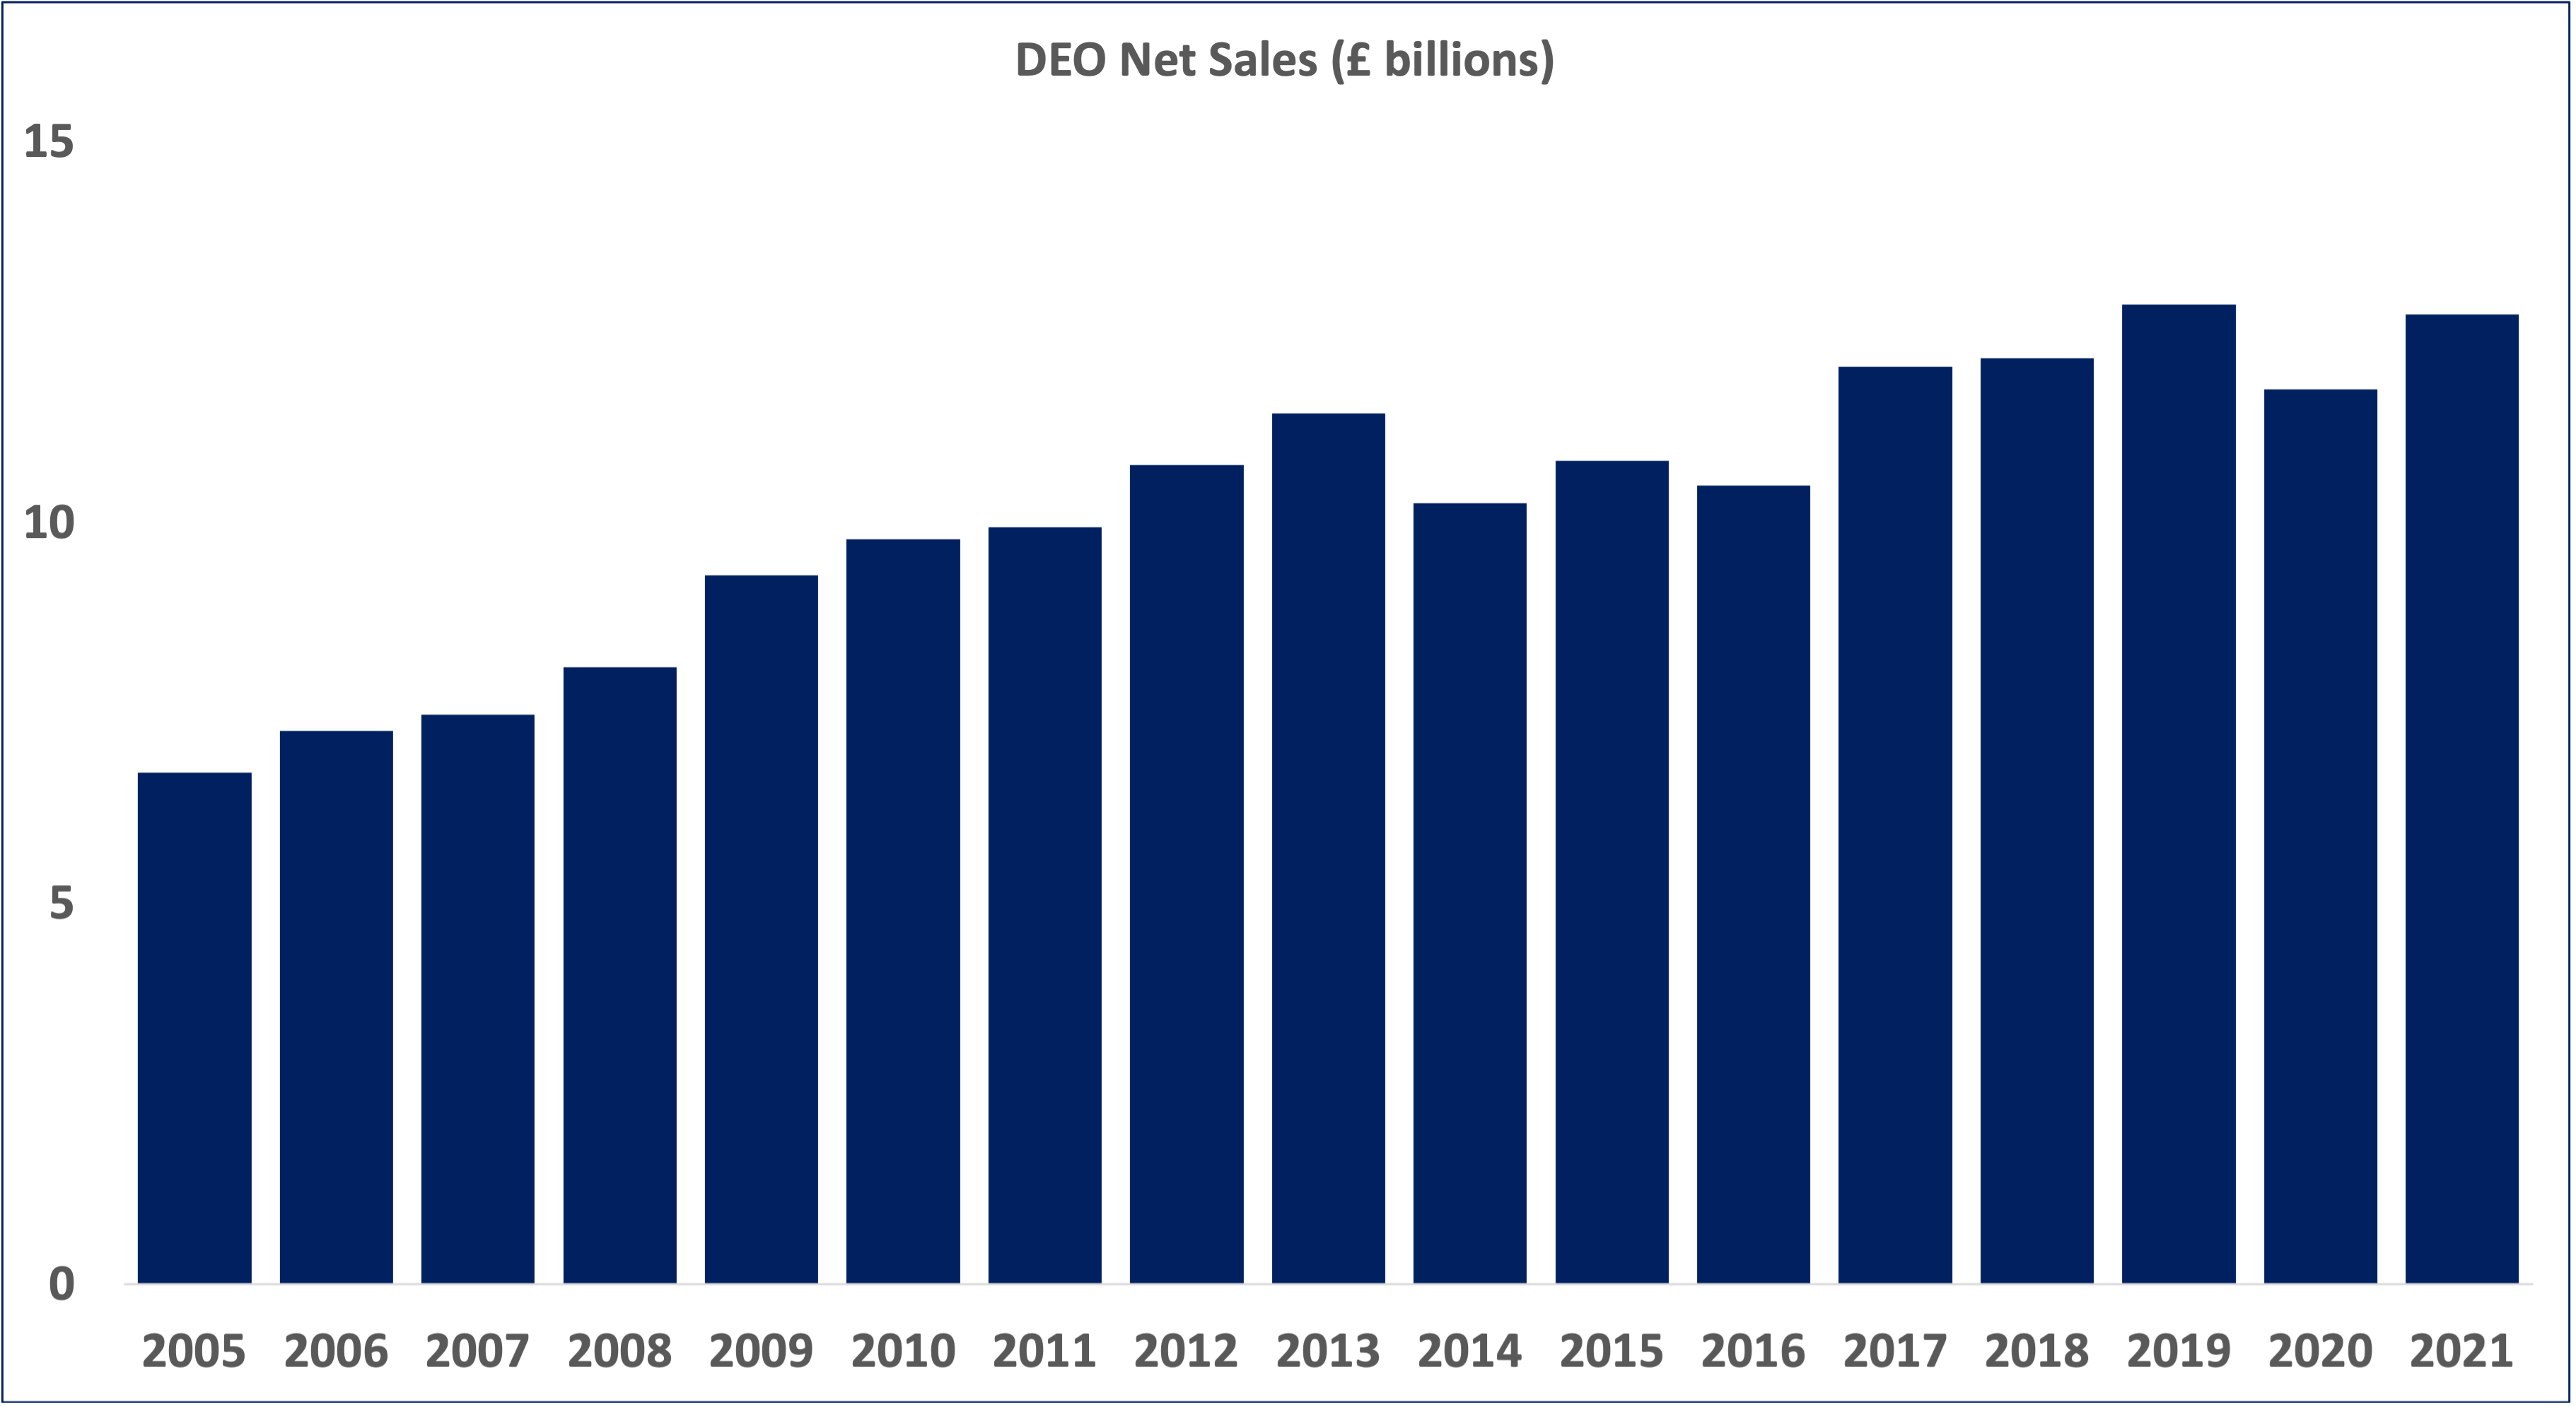
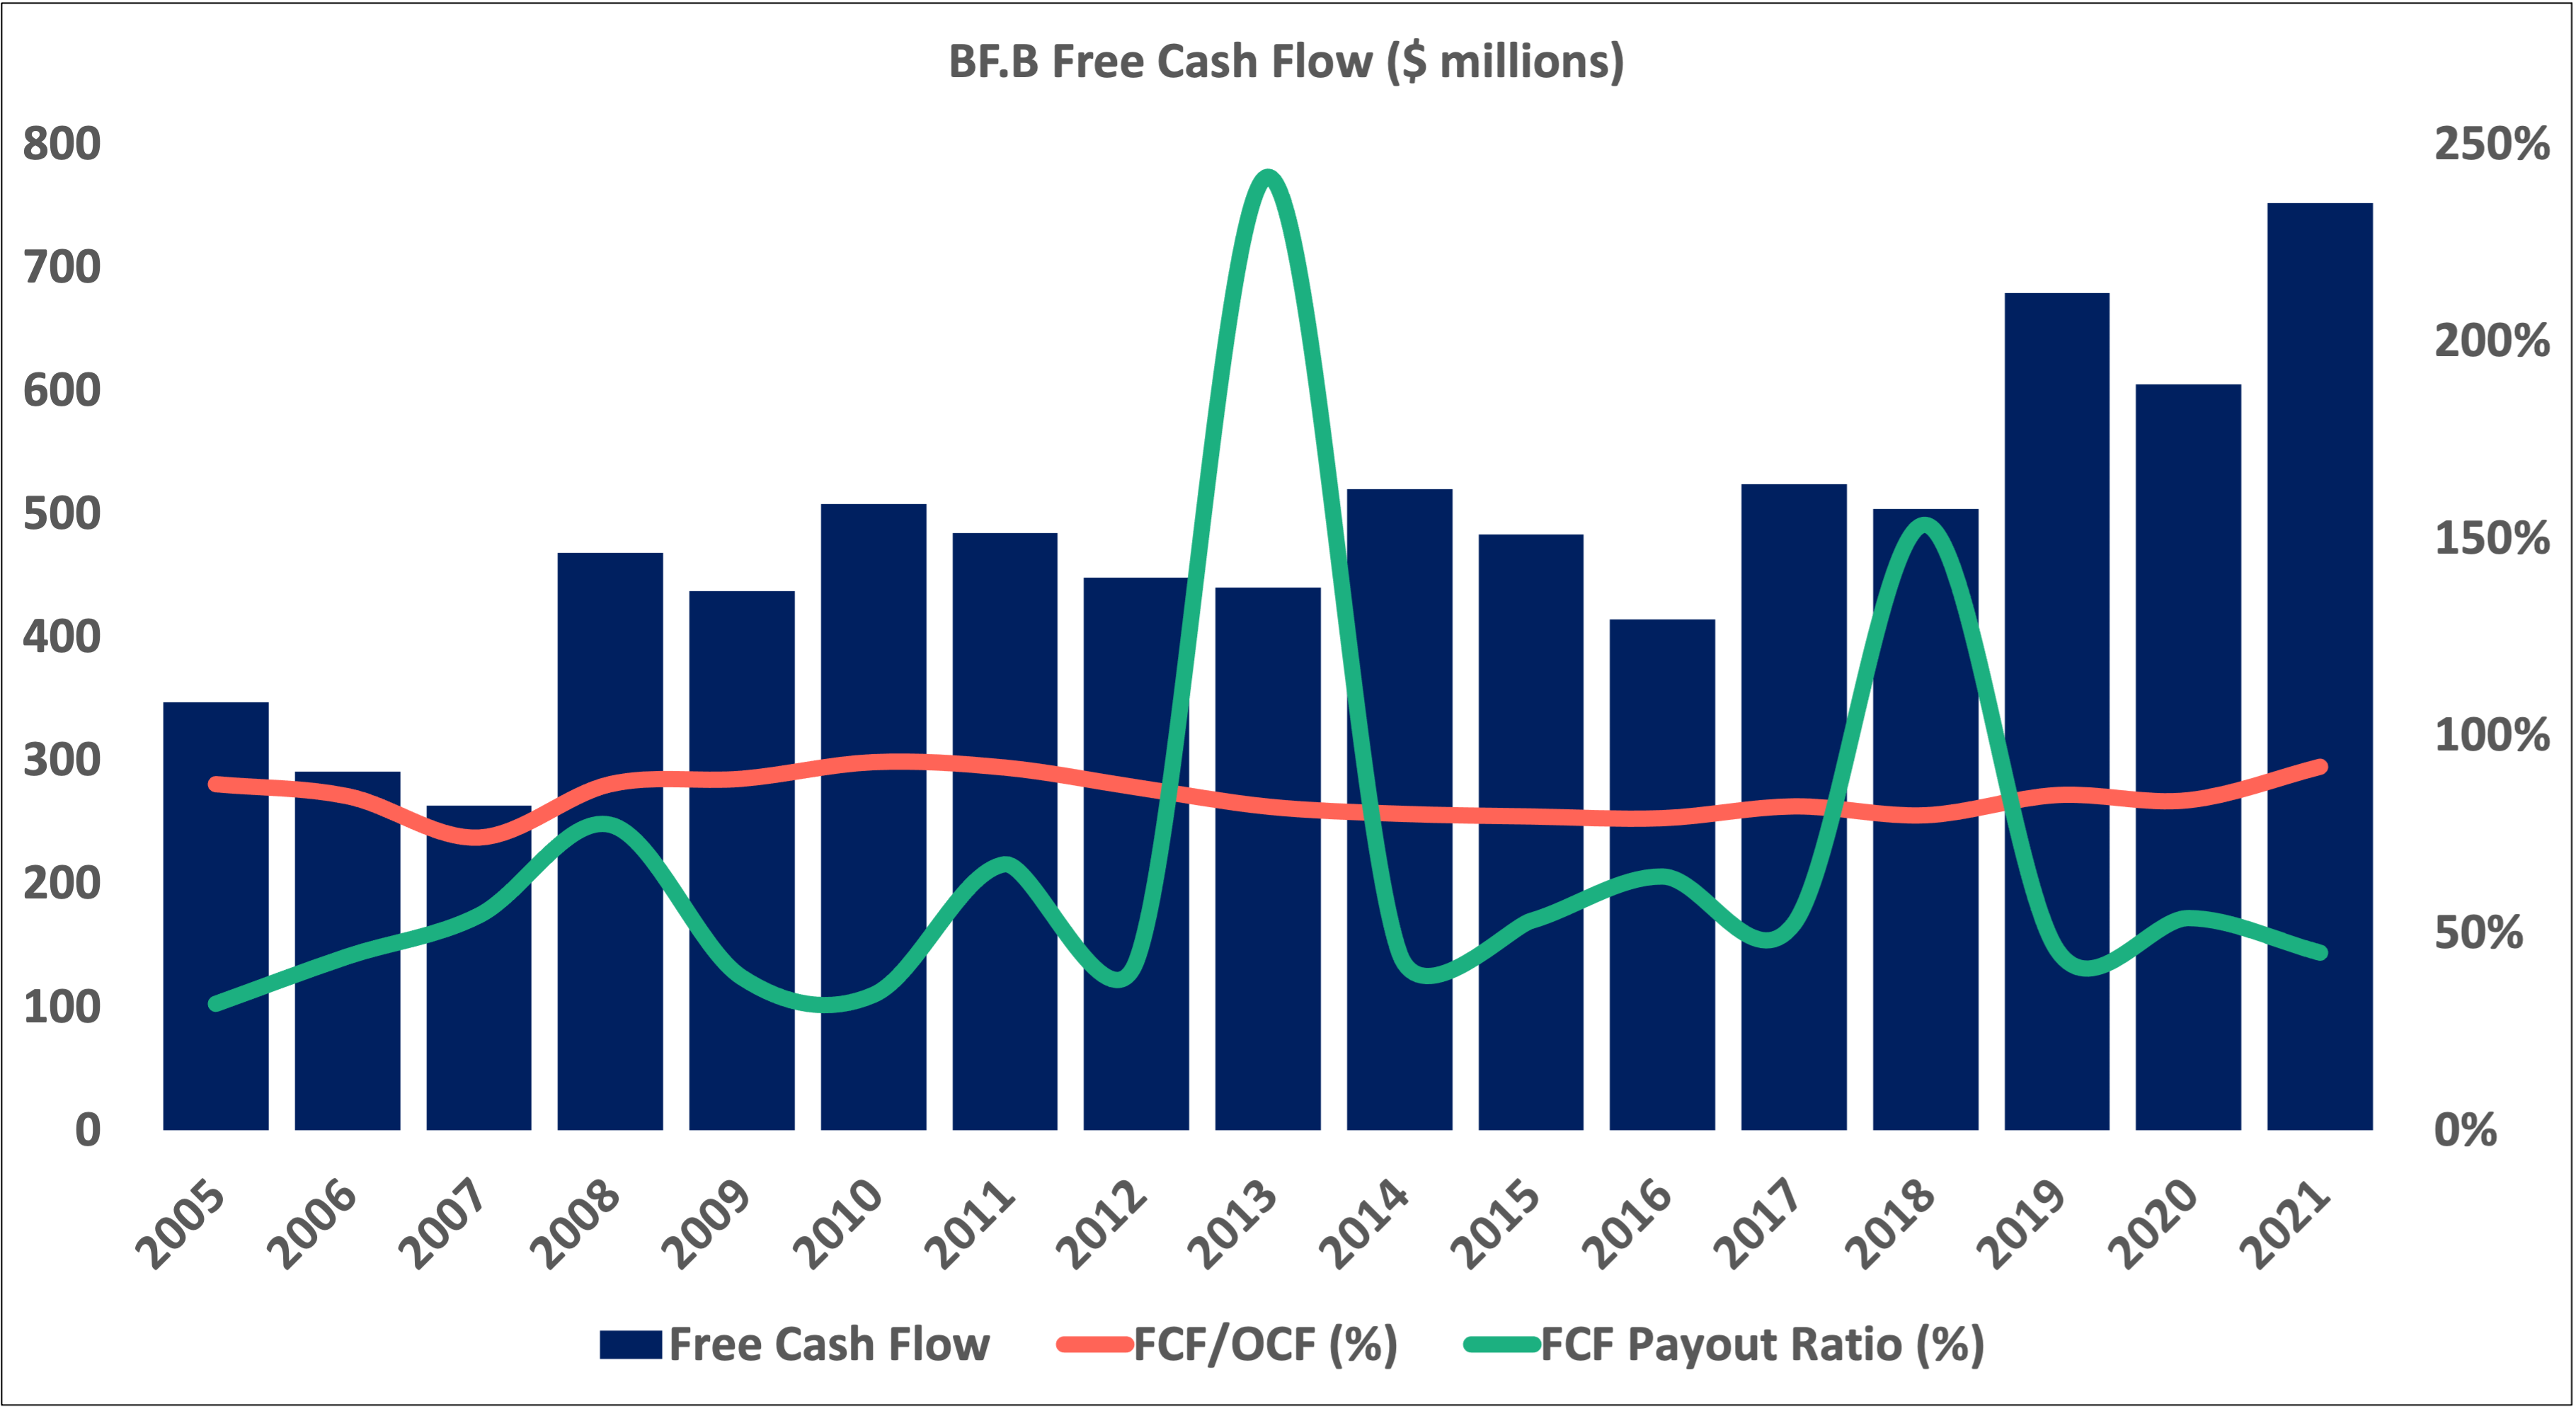
Covid. Diageo has been hit especially hard by Covid due to its exposure to on-premise consumption (i.e. going out). Its highly diversified, global portfolio and the tendency of consumers to buy and drink its alcohol products at bars, pubs, and restaurants took a notable toll on Diageo’s business in 2020. Free cash flow fell almost 40% in 2020 (compared to an 11% drop at Brown-Forman). Fortunately for shareholders, the company is seeing a rebound as consumers have been leaving the home more often in 2021.
Whereas Diageo saw a big drop in net sales in 2020, Brown-Forman saw an increase. Brown-Forman has been able to weather the pandemic better than Diageo probably in part thanks to (1) having more exposure to the U.S. market relative to other markets; (2) its portfolio of brands which are better suited for at-home consumption as opposed to on-premise; and (3) its successful expansion of ready-to-drink product lines led by Jack Daniels Country Cocktails, which has been around since the 1990s. Successful product launches have a bigger impact on Brown-Forman’s top line than they do on Diageo’s due to Brown-Forman’s smaller size and more concentrated brand portfolio. Because Diageo is so big in terms of net sales and its portfolio of brands, it is tougher for management to move the needle quickly with efforts like RTD.
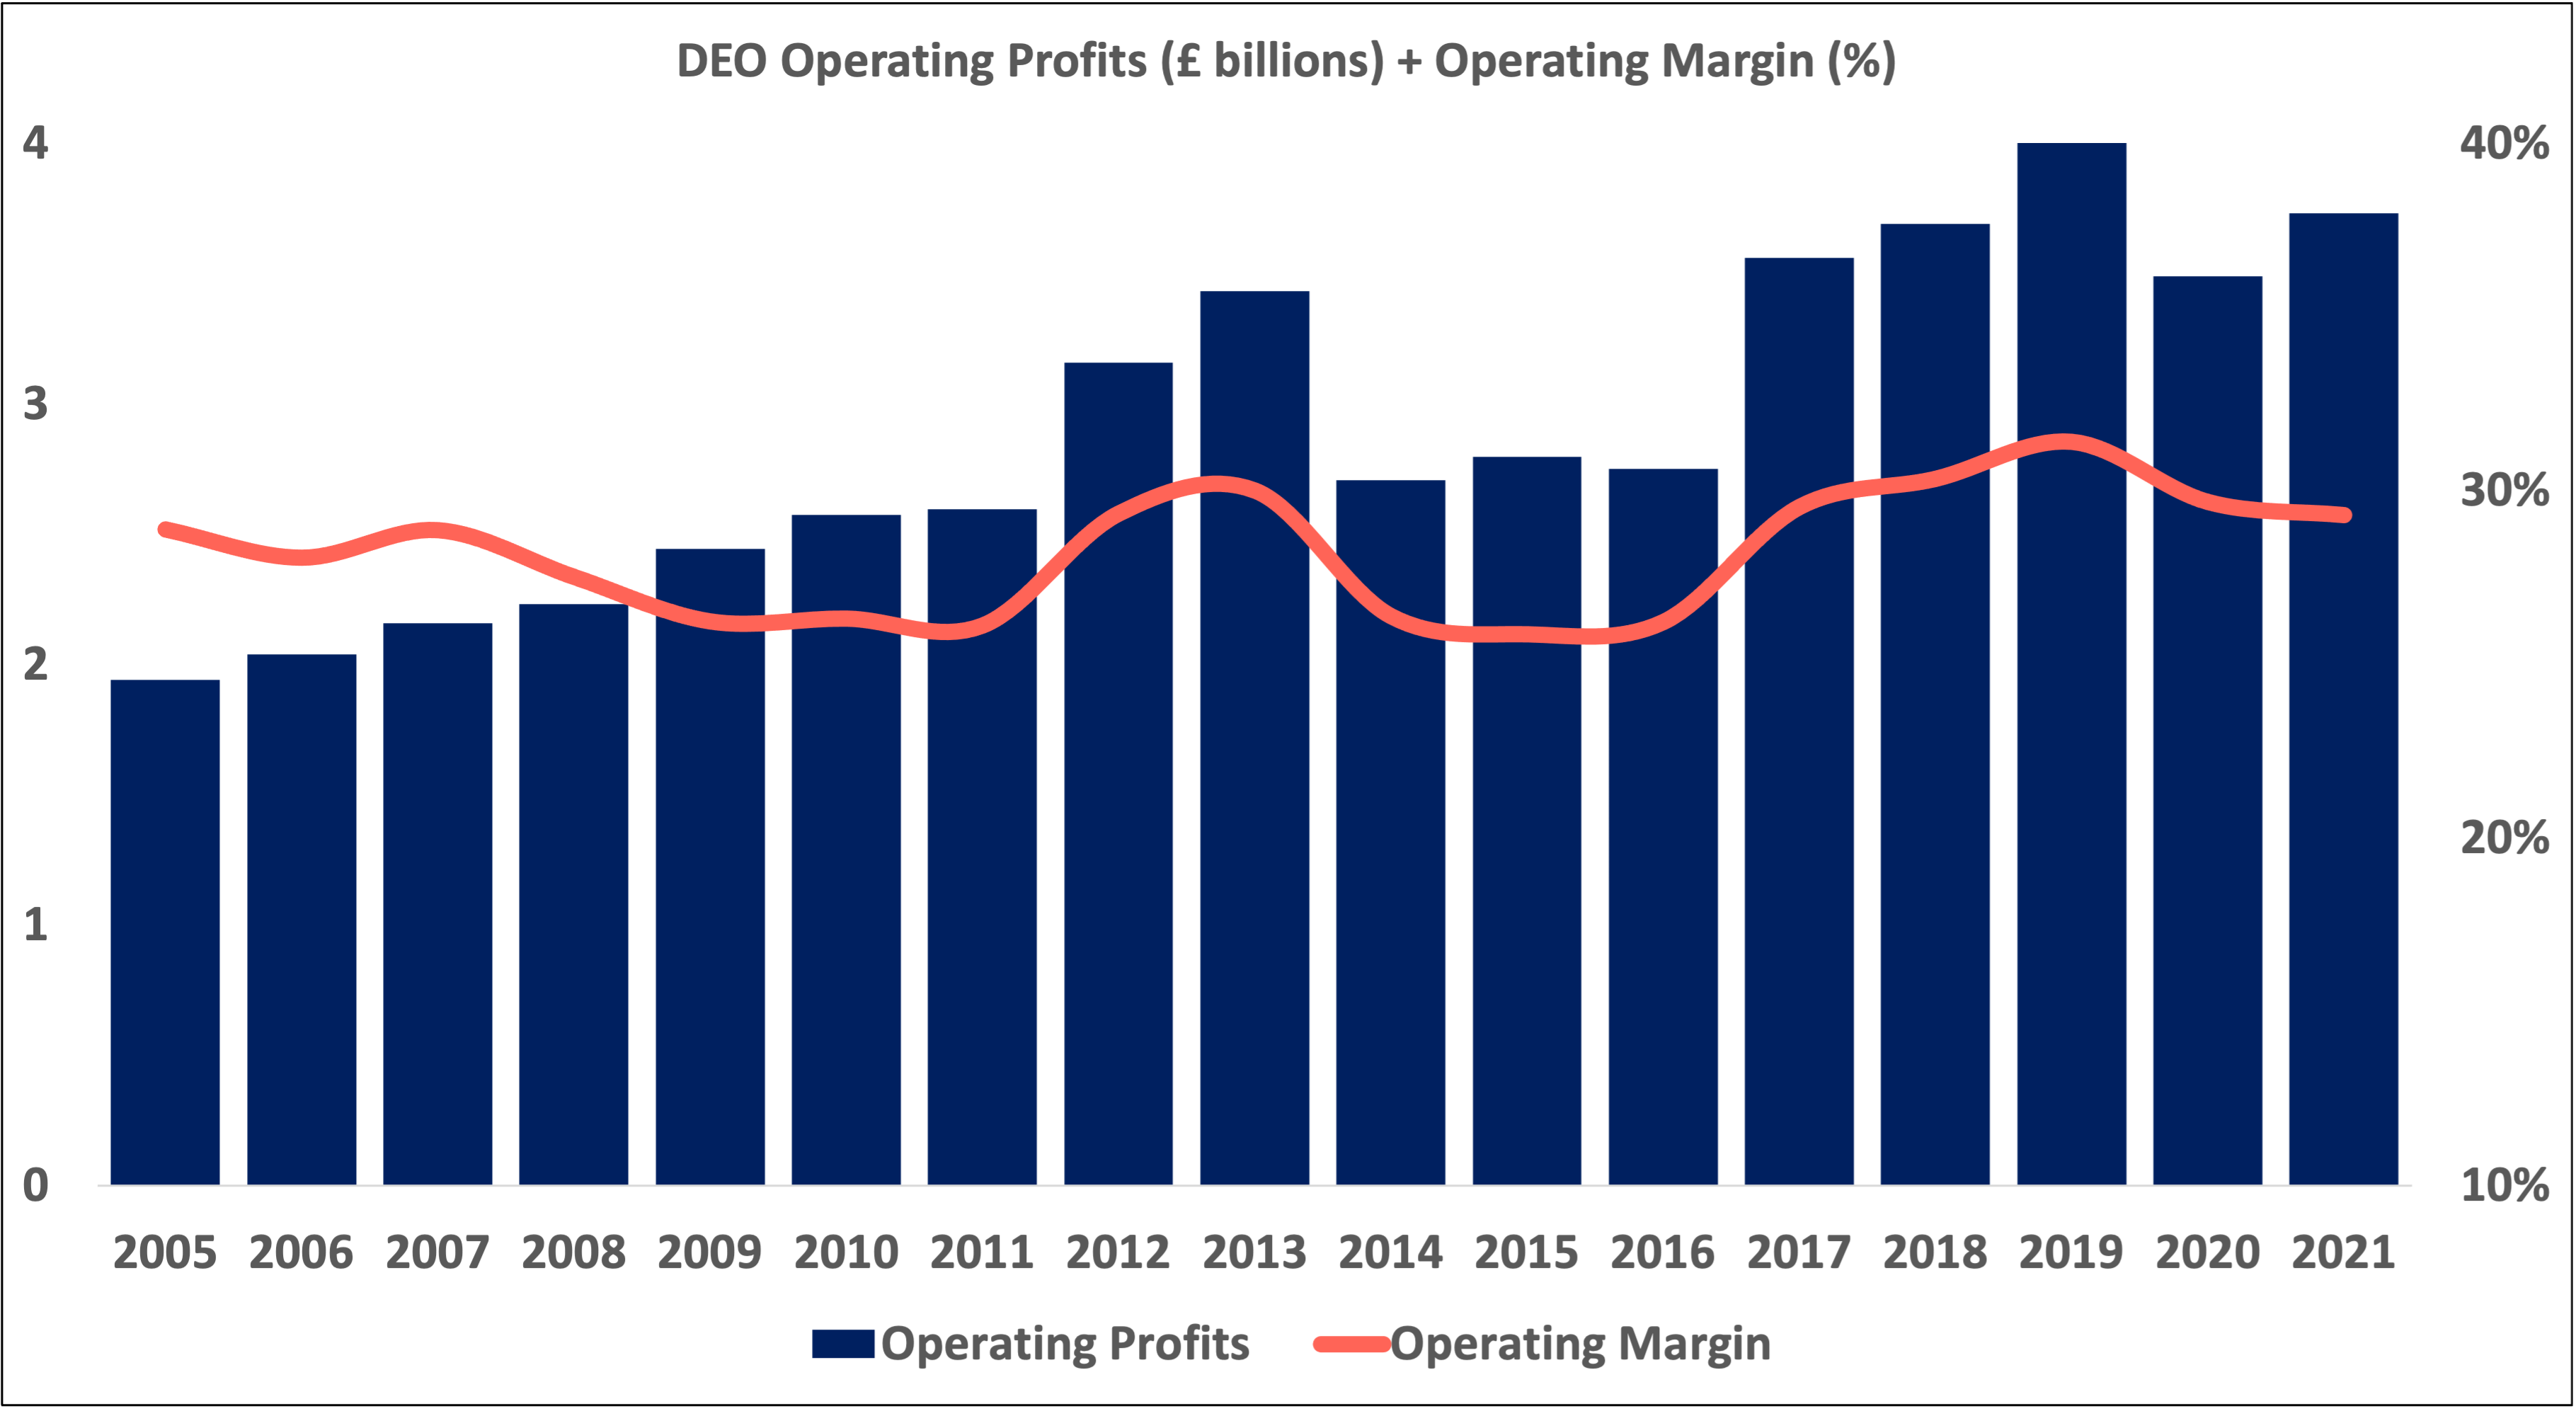
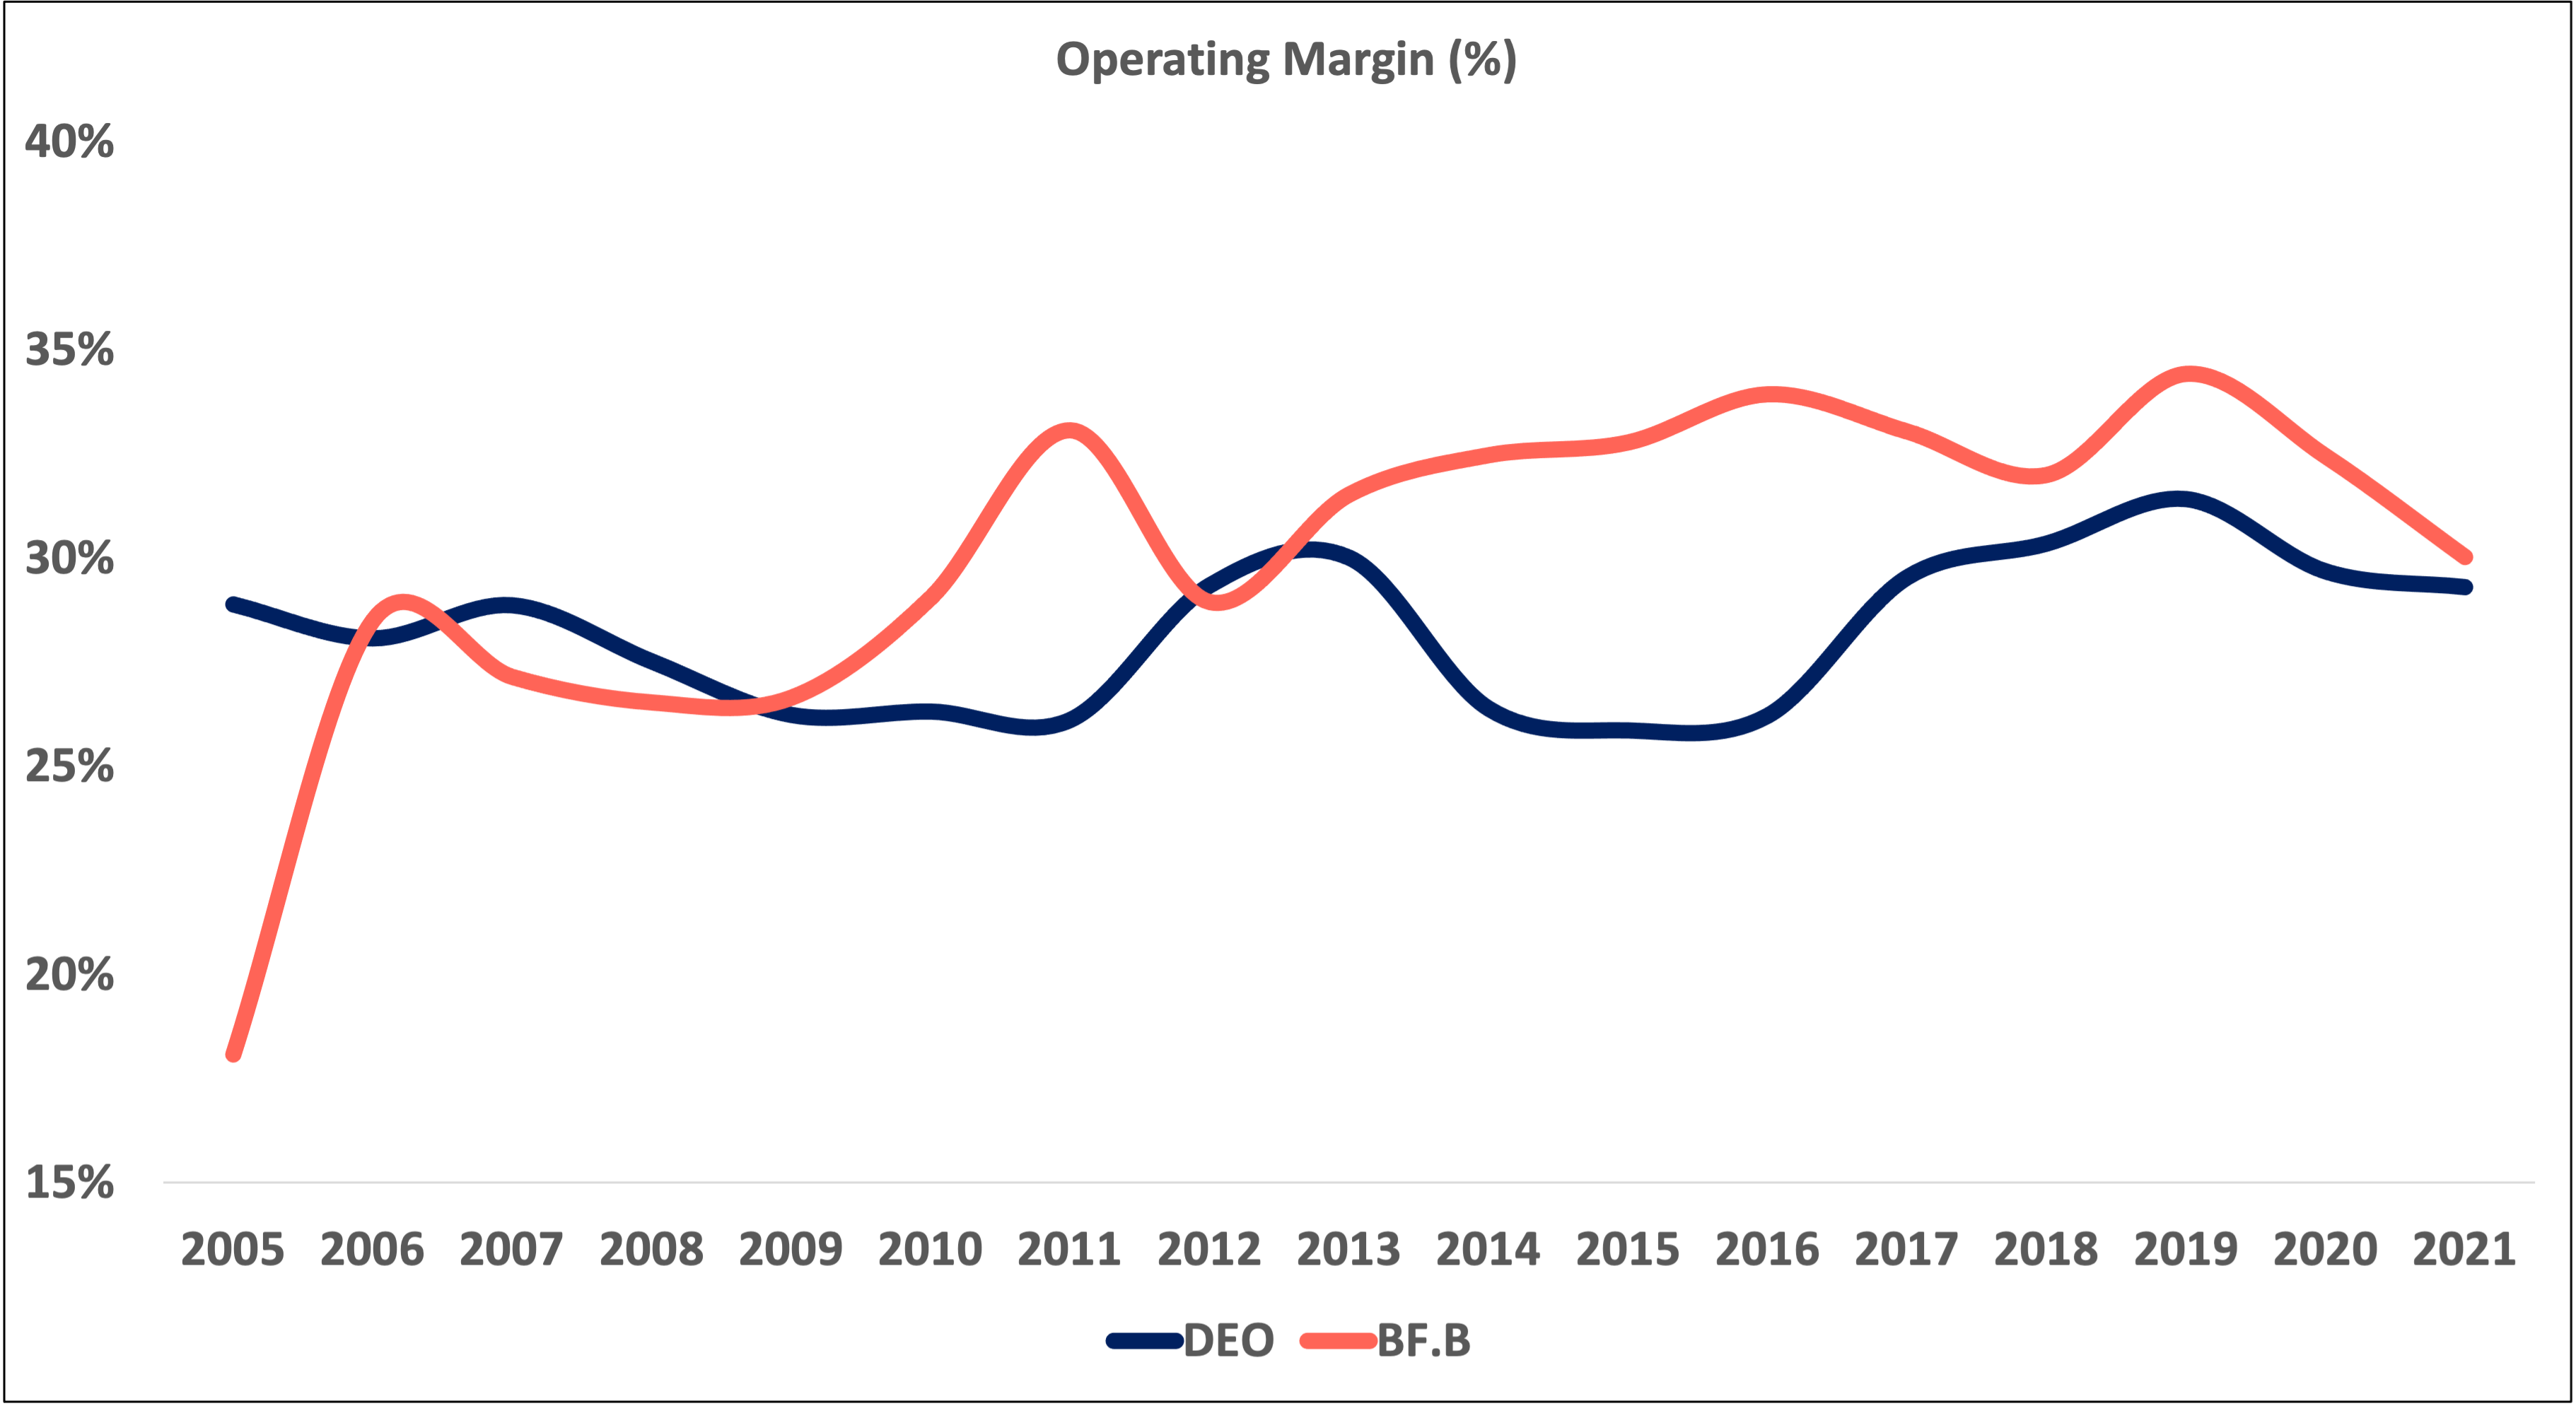
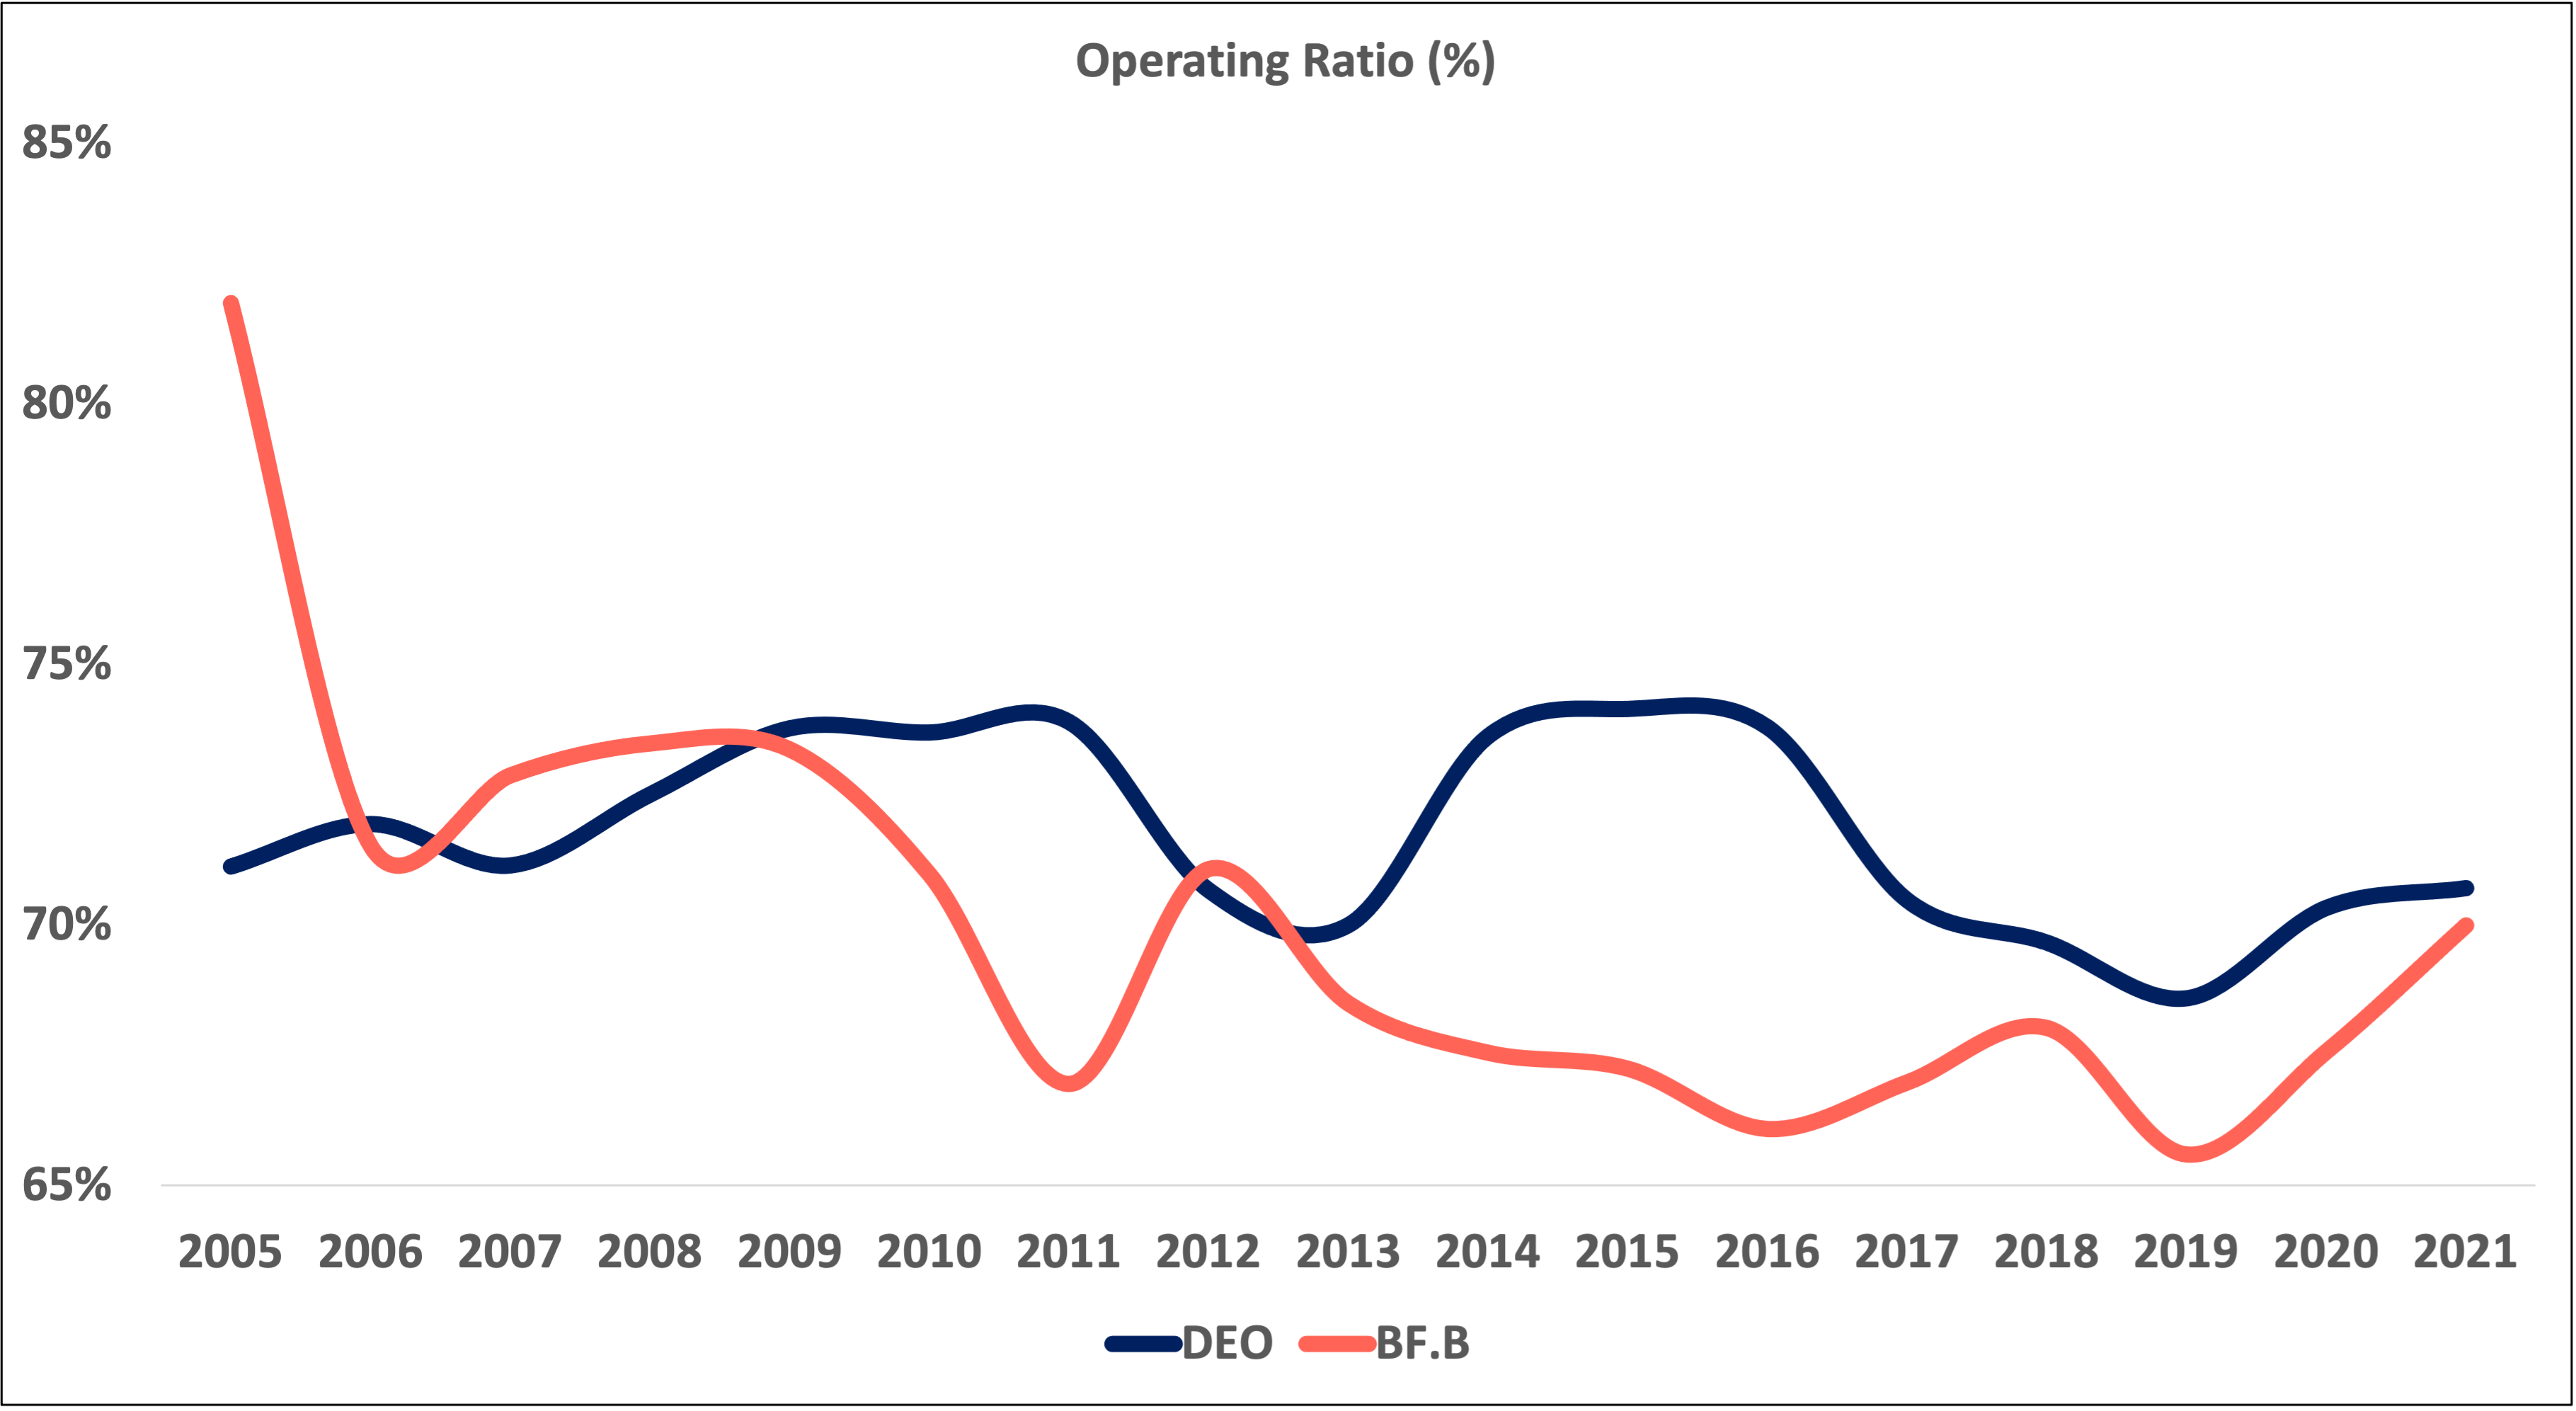
Operating profitability + efficiency.
Shareholder friendliness. Diageo’s (via DGE, paid in pence) and Brown-Forman’s dividend growth rates have been trending down in recent years. If you bought DEO (paid in dollars), the growth of your dividend payment has been much more variable thanks to the pound-to-dollar exchange rate.
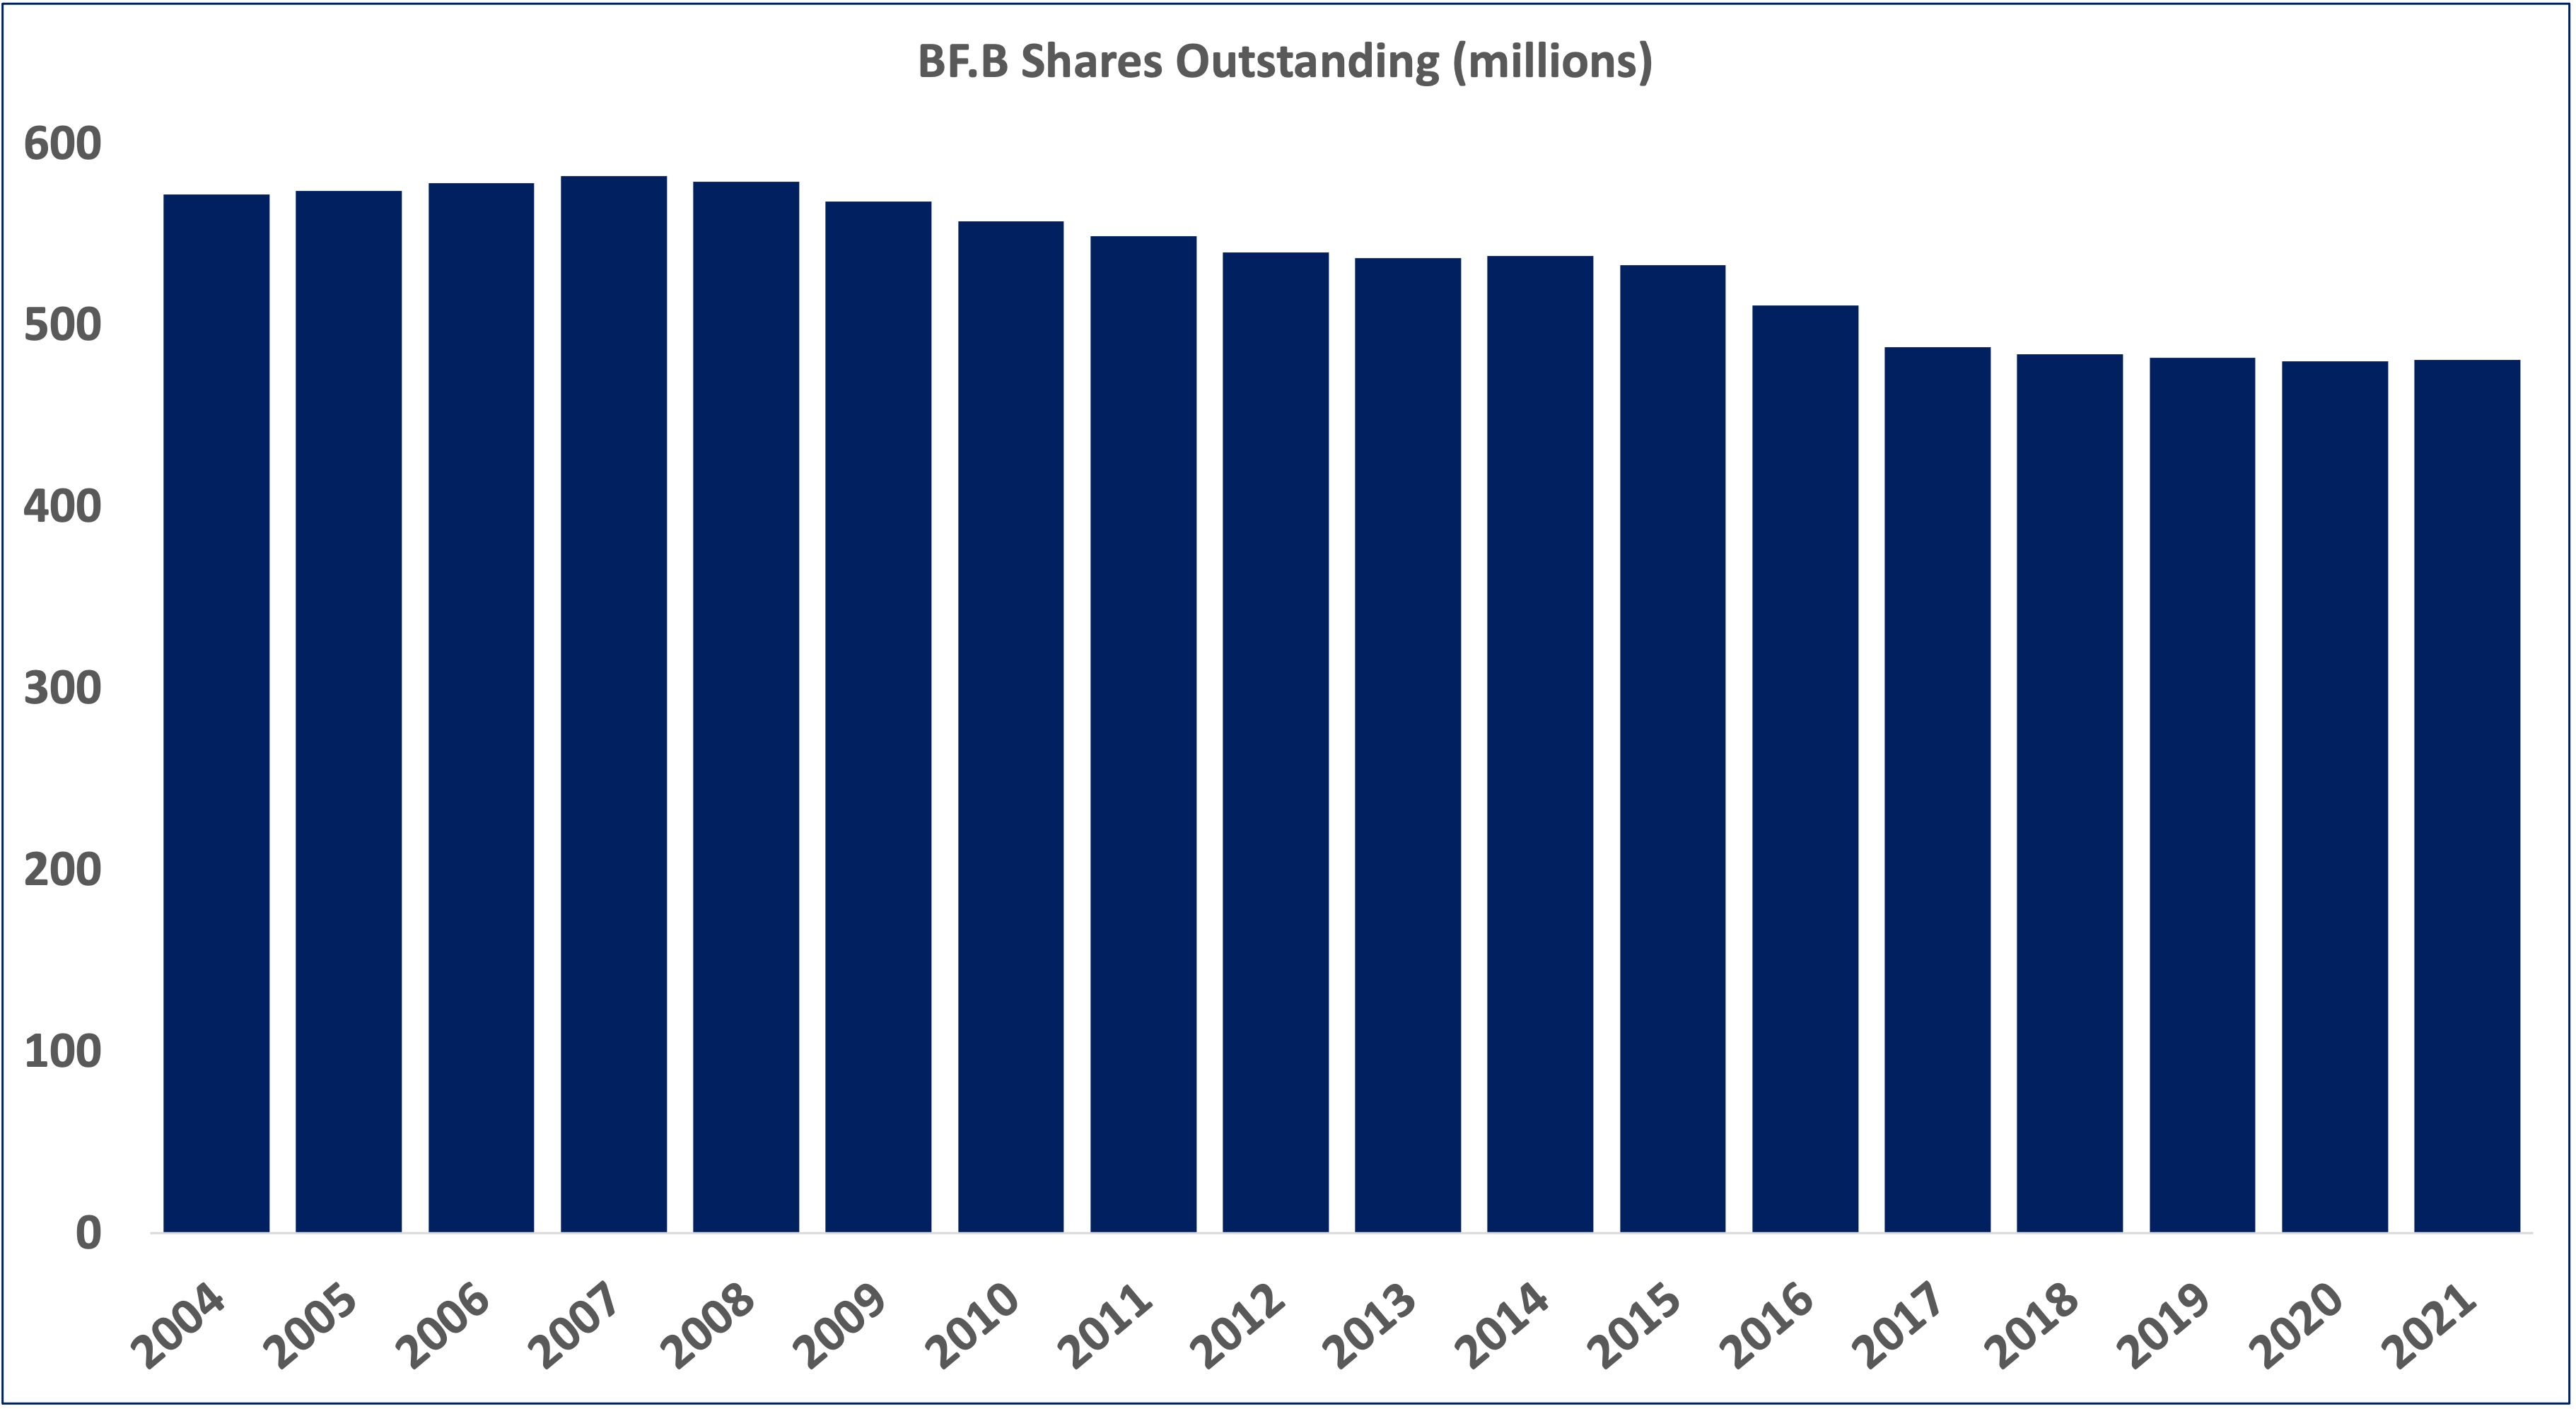
Diageo has reduced its share count by over 21% since 2005 while Brown-Forman has reduced its share count by over 16% over the same time period.
Both companies have more than doubled their free cash flow, respectively, since 2005 (112% increase for Diageo and 116% for Brown-Forman).
Taxes. Diageo has posted a 20.6% average effective tax rate since 2005. Brown-Forman has posted an average of 28.6% over the same period. Both are trending around 20%. The average money-making alcoholic beverages company in the U.S. pays an effective tax rate of 18.36%.
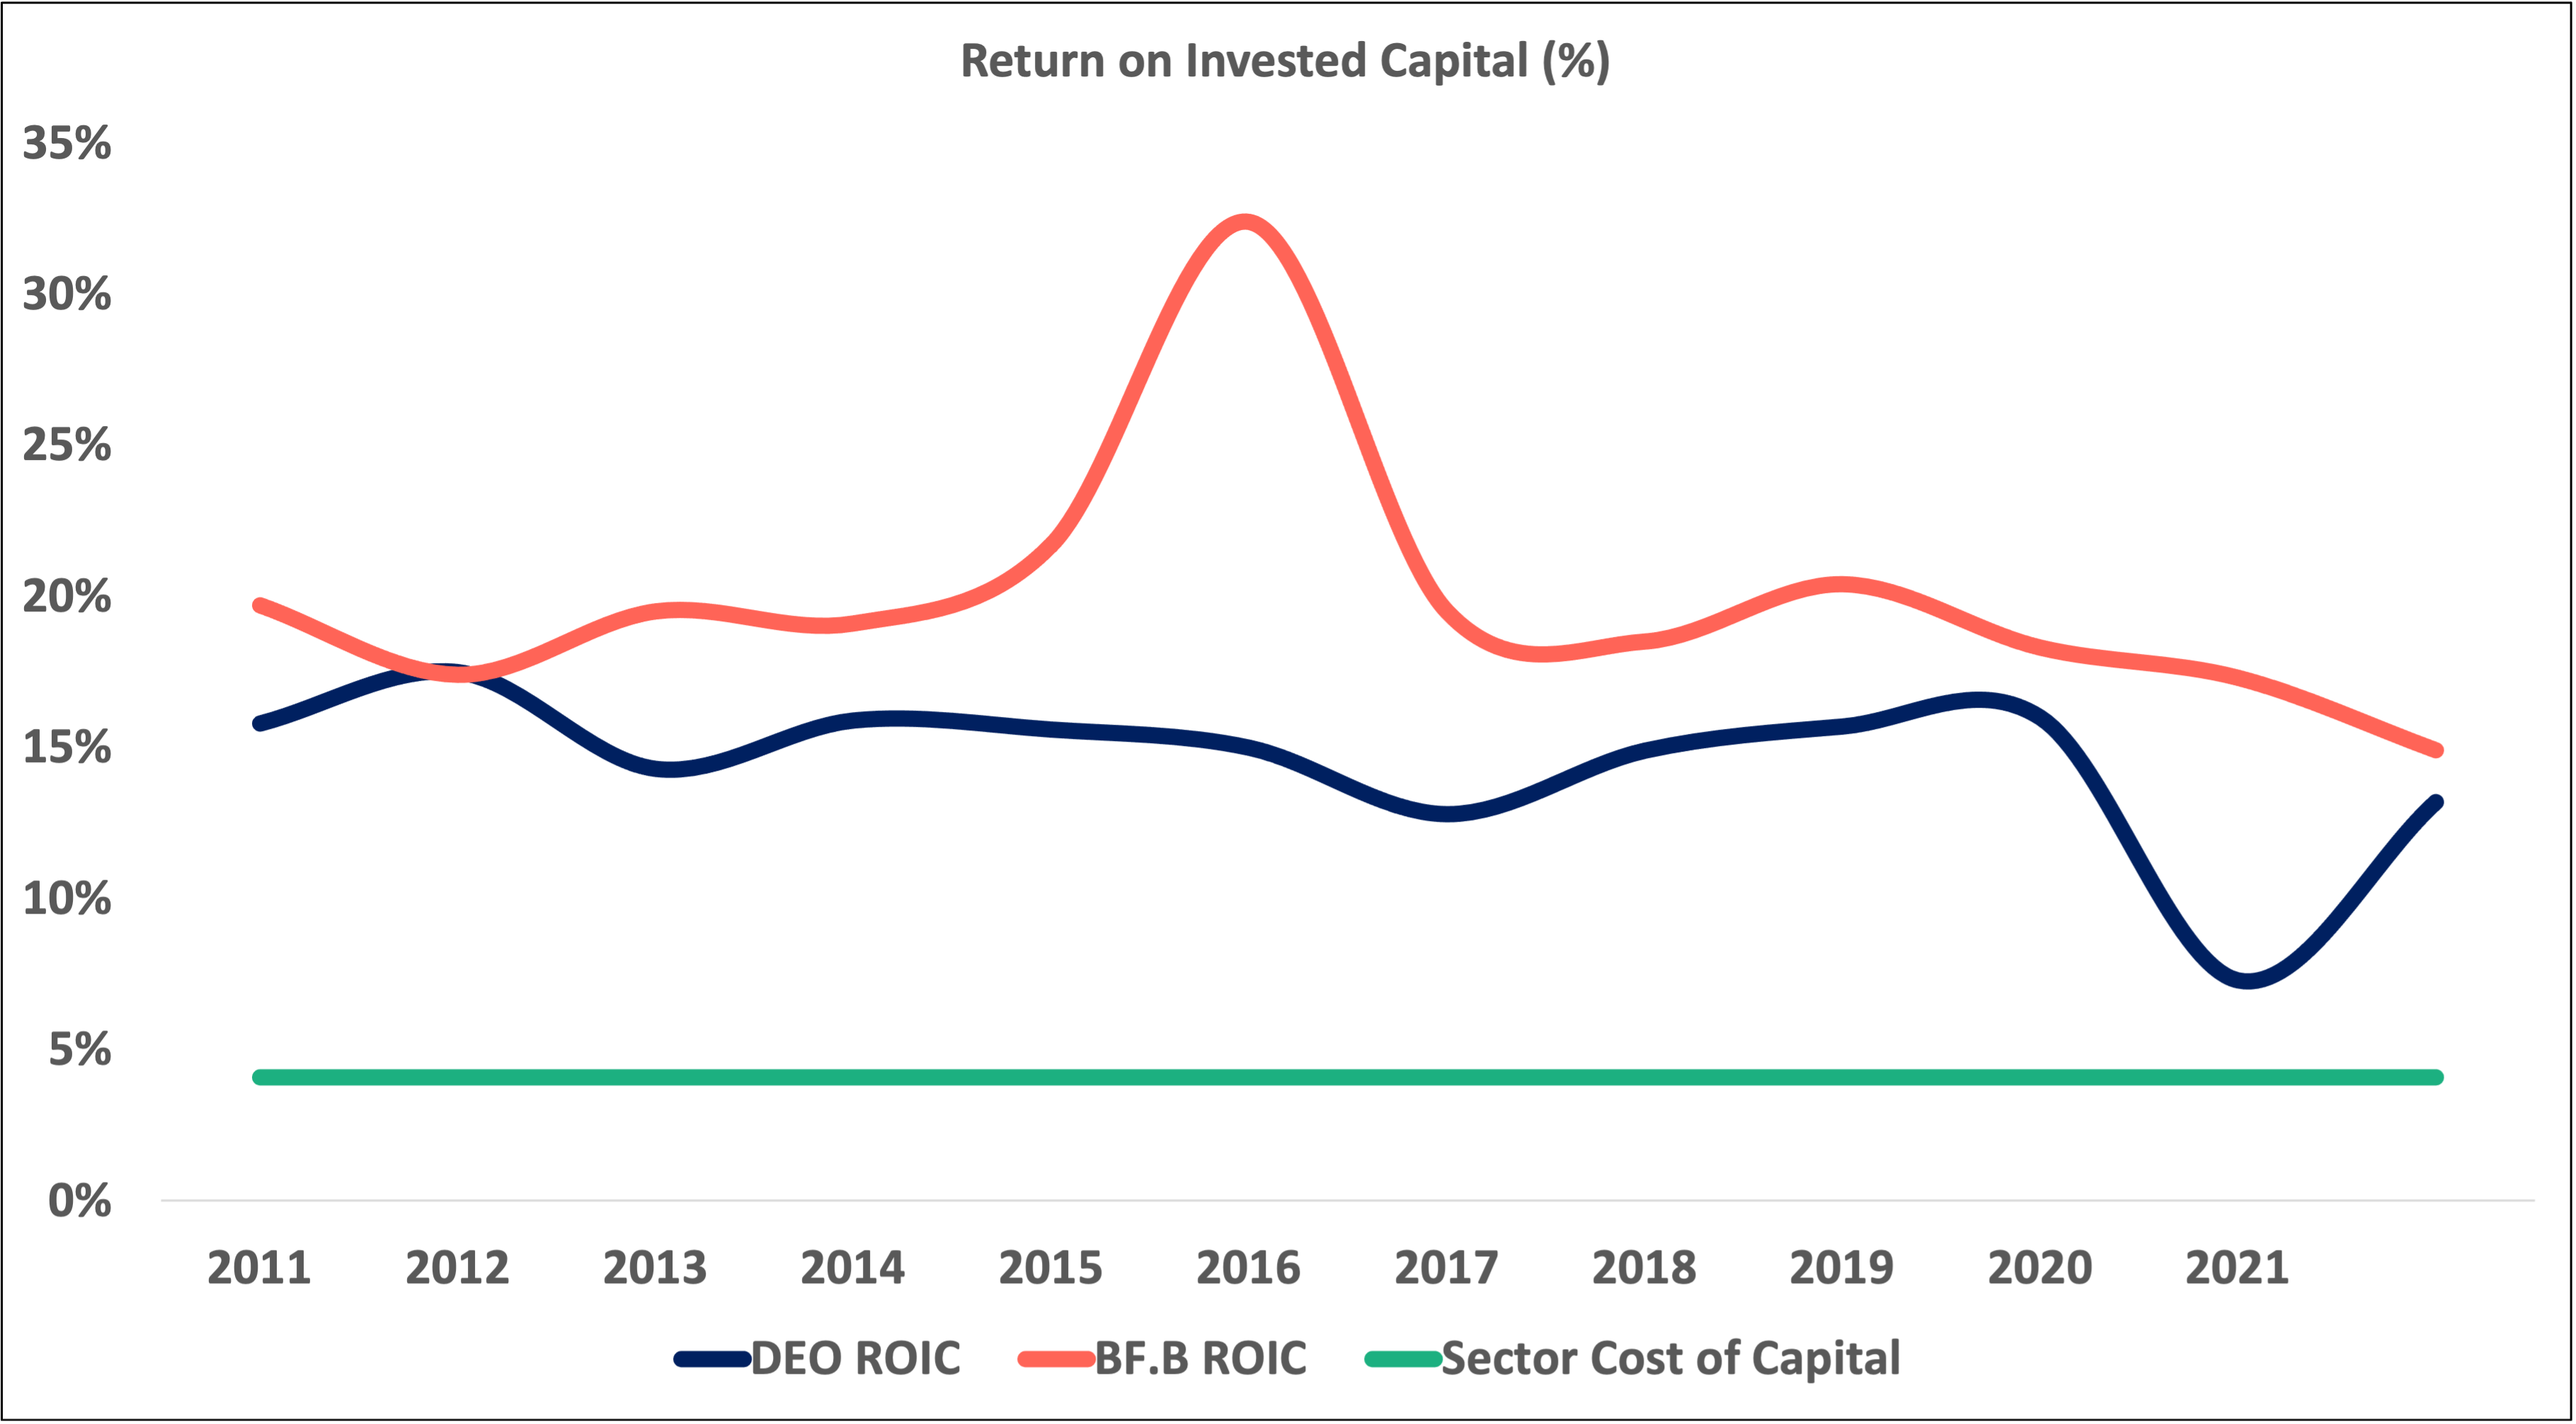
Value creation.
Durability and moat. People have been drinking alcohol for thousands of years and will continue to drink it for thousands more. As far as consumer goods go, alcohol is in the upper echelon of durable industries. It is frequently purchased and used both in and outside the home in all sorts of settings. And while there are competing substances out there (e.g. cannabis and nicotine), they often cater to different user needs and social settings — they aren’t exactly perfect substitutes for alcohol, though some data has shown that states which permit medical marijuana do see not insignificant decreases in alcohol sales.
Other data has shown that, generally speaking, demand for alcohol remains pretty strong even when faced with price increases — a 10% increase in the price of alcohol leads to a relatively low decrease in consumption.
With that said, even though the alcohol industry is very durable, there is a lot of competition within it. Certain types of alcohol are faltering (beer) while others are gaining market share (spirits). Diageo and Brown-Forman will remain dominant players in this durable industry because of their focus on (1) the growing spirits category and (2) premium alcohol brands.
If it isn’t obvious by this point, both companies have wide moats thanks to their brands. High end alcohol brands are insulated from private label threats and benefit from consumers using them not only for personal consumption but also as signals of status. High end alcohol brands create a sense of luxury when being ordered, displayed in bottles, and consumed, especially in front of others. Furthermore, high end alcohol brands are on the more affordable end of the luxury goods spectrum. Most of us can’t afford Ferraris or Birkin bags, but many of us can stretch our wallets for a bottle of Johnnie Walker or a shot of Casamigos. Thus, accessible luxury is an important component of these companies’ brand-centered moats.
Spirits drinkers also tend to develop a sense of identity around the spirits brands of their choice. For example, a drinker might say, “whiskey + ginger ale — that’s my drink!” That drinker might have a strong preference for Jack Daniels mixed with ginger ale. The fact that drinkers feel that their brands of choice say something about them leads to a strong sense of brand loyalty. Wine brands don’t have the same sort of draw — while a drinker might prefer pinot noir over merlot, drinkers tend to jump from one wine brand to the next without much thought — it’s more about trying new varieties made from grapes from different vineyards located on different continents. On the other hand, those who drink spirits tend to subscribe to one favorite brand in any given spirits category.
Diageo and Brown-Forman also benefit from the production facilities that they own, which provide them with production cost advantages over competitors with less scale. Because they are such large companies, they have also developed advantages over smaller competitors when it comes to bargaining with suppliers. Suppliers are sellers of commodities like grain, and they depend on selling their commodities at high volumes, so a company with scale has an advantage over a smaller company without scale because the bigger company can buy the inputs at a volume discount (or buy all the inputs in a given location, cutting off regional competitors). This scale advantage is magnified by the fact that distillery inputs are commodities while their outputs are high margin branded products.
Before even worrying about how to compete brand-to-brand, potential competitors must prepare to put up millions of dollars to pay for distillery equipment and other start-up production costs. These costly outlays magnify the risk of a product not succeeding in the marketplace, discouraging new competitors from entering the market. In the instances where new entrants do breakthrough, both companies have the capital to make acquisitions (see Diageo’s 2017 acquisition of George Clooney’s Casamigos).
To illustrate how difficult it is for a competitor to enter the market, let’s pretend we’re a high end whiskey startup in Kentucky. We can’t buy grain mash any cheaper than nearby Brown-Forman, we need several million in capital to build a distillery and start the aging process, which for many types of whiskey can take three to five years to get the final product ready for sale. Since we don’t have a distillery or any ready inventory, we don’t have any distributors lined up to buy cases wholesale. Some would call this a “chicken and egg” problem. The only way to produce whiskey at the lowest possible cost is to have a distillery cranking out whiskey for distributors to buy. Distributors won’t place orders unless you have the inventory and ongoing ability to produce enough whiskey to meet demand. And, it’s hard to justify the cost of building/buying and running a distillery for years without first having distributors lined up, buying up inventory. Thus, this “chicken and egg” dynamic creates a two-sided advantage for incumbents like Diageo and Brown-Forman.
In summary: the alcoholic beverage industry is highly durable (but competitive) and Brown-Forman and Diageo have wide moats thanks to brand, capital, and scale advantages.
Definitions —
Debt ratio. See “Inverse current ratio” definition below. Whereas the inverse current ratio measures a company’s short term liabilities as a percent of its liquid assets, the debt ratio measures a company’s total liabilities as a precent of all its asset. A company with a low debt ratio (e.g. 25%)
Free cash flow pay out ratio. The FCF pay out ratio measures what percent of free cash flow is used to pay the dividend.
Free cash flow to operating cash flow ratio. FCF/OCF measures the proportion of operating cash flow that is not eaten up by capital expenditures. A higher FCF/OCF ratio means a company is spending a lesser proportion of the cash it earns from operations on CAPEX and so it has a higher proportion left over for buy backs, dividends, acquisitions, and business expansion. In other words, it measures a company’s ability to convert operating cash flow into free cash flow.
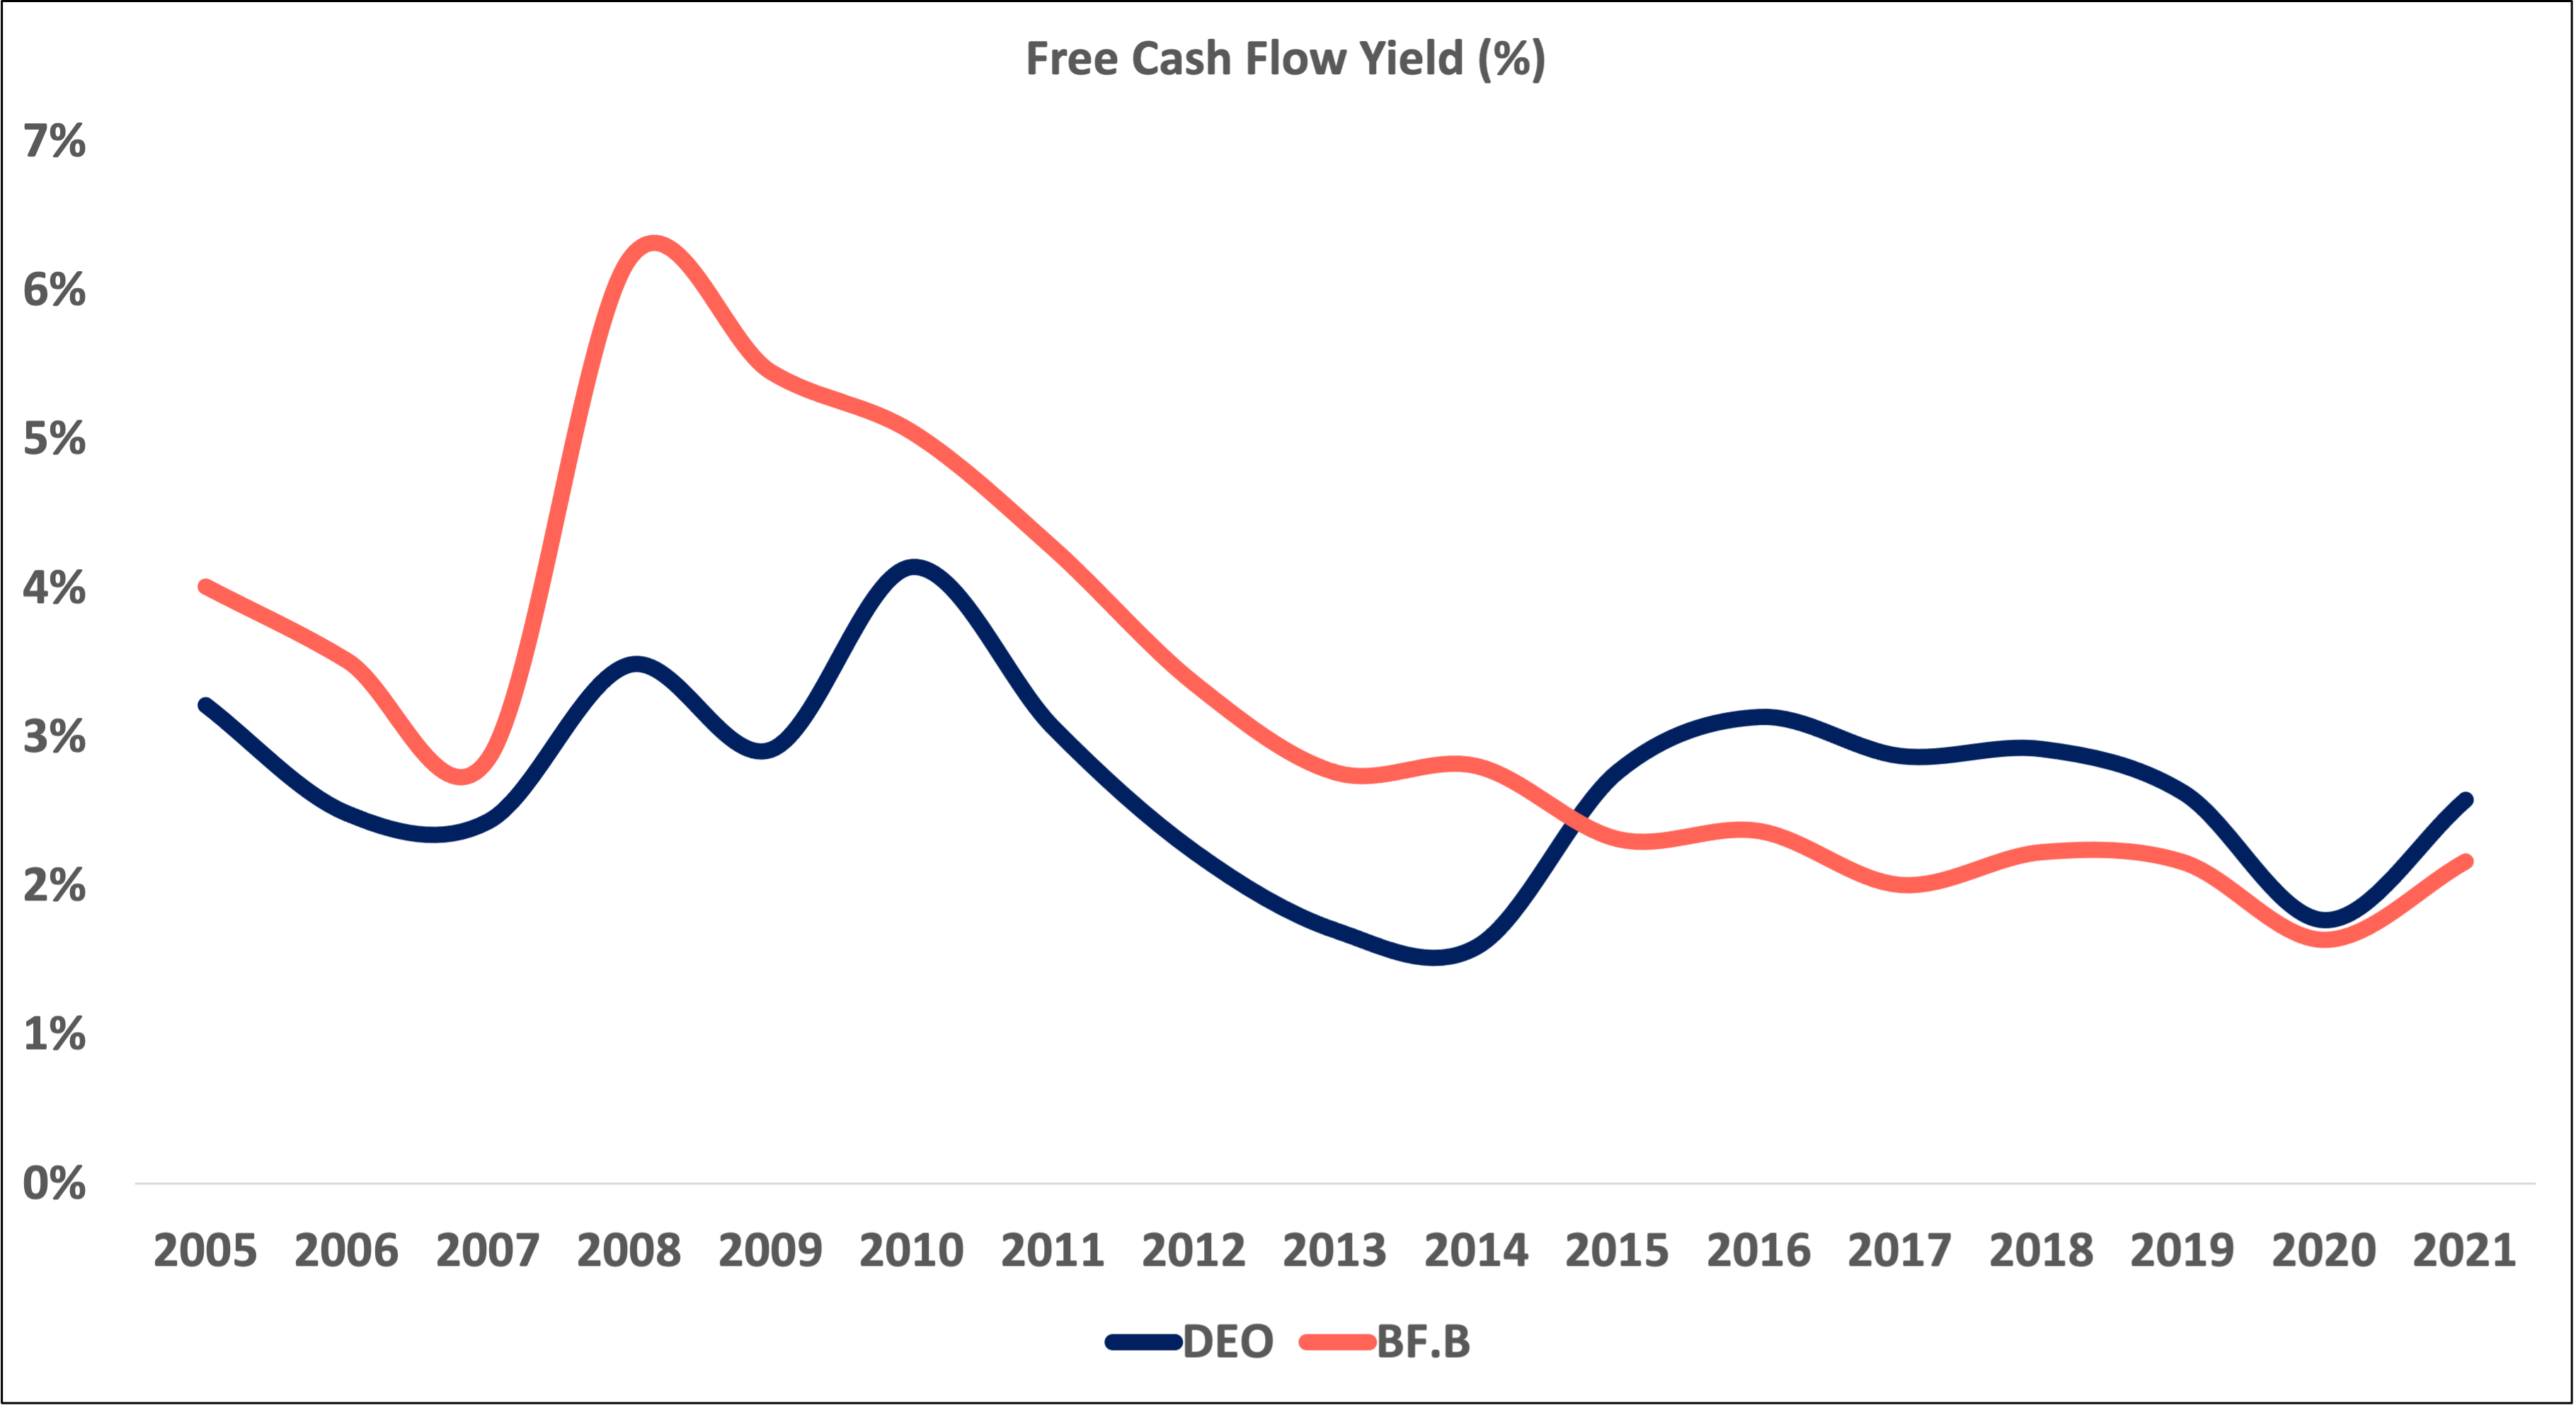
Free cash flow yield. FCF yield measures how much cash a company generates (after operating and capital expenditures) relative to the company’s market capitalization. This “free cash” can be used for paying down debt + interest, buying back stock, paying out dividends, acquiring companies, expanding the business, etc.
Inverse current ratio. The inverse current ratio (expressed in % terms) measures a company’s short-term obligations (current liabilities) relative to its readily-available assets (current assets). Current liabilities include items due in a 12-month period: accounts payable, taxes, debt + interest due in that 12-month period, payroll, dividends, etc. Current assets include cash, cash equivalents, marketable securities, accounts receivable, inventory, pre-paid liabilities, and other assets that can be converted to cash very quickly. A company with a high inverse current ratio (e.g. 95%) indicates that the company will need almost all of its current assets to cover its current liabilities.
Operating margin. Operating margin measures how profitable a company’s business operations are after paying for operating costs but before paying for interest and taxes. In other words, it is how efficient a company’s core operations are at converting net sales into profits.
Operating ratio. The operating ratio measures a company’s ability to control expenses. A lower OR is better. OR = OPEX + COGS / Net Sales.
Thanks for reading. Send me any questions or comments at pricetowealth@gmail.com. Let me know if you would like me to cover a certain topic, company, or industry. If you have not already subscribed, you can do so here. Also, feel free to follow me on Twitter @PricetoWealth.
Disclaimers — Nothing in this newsletter is investment advice. Nothing in this newsletter is an invitation, recommendation, offer, or solicitation to buy any security, investment product, or investment advisory service. The information herein is for general informational, discussion, and entertainment purposes only. Do your own due diligence. We make no representation, warranty or undertaking, express or implied, as to the accuracy, reliability, completeness, or reasonableness of the information contained in this article. Any assumptions, opinions, or estimates expressed in this article constitute our judgment as of the date thereof and are subject to change without notice. This newsletter may contain statements that we consider to be reasonable; however, such statements necessarily involve risk, uncertainties, and assumptions, and investors should not rely on any of these statements when making investment decisions. Price to Wealth is not acting as your financial, accounting, tax, investment, legal, or other advisor or in any fiduciary capacity.